Data-driven commissioning · Part 2
Best at Getting Paid. Worst at Being Kept.
Vertical micro-drama is both at once, and the numbers to show it were published three days ago. Part two of a series on data-driven commissioning.
In part one I made a claim I couldn’t prove.
I said completion and retention can come apart — that a slate optimised against captured signal should get very good at holding attention inside a title while having no purchase at all on whether someone is still a subscriber next month. And I said the gap between those two numbers is the thing to watch, because most operations aren’t arranged to see it.
That was a prediction about what measurement would show if anyone measured it.
Three days ago somebody did.
The scissors
On 28 August, RevenueCat — which processes subscription infrastructure for a very large number of mobile apps and therefore sees anonymised revenue data across them — published an analysis of short-drama apps specifically, benchmarked against everything else in the Entertainment category.
Here is what it found.
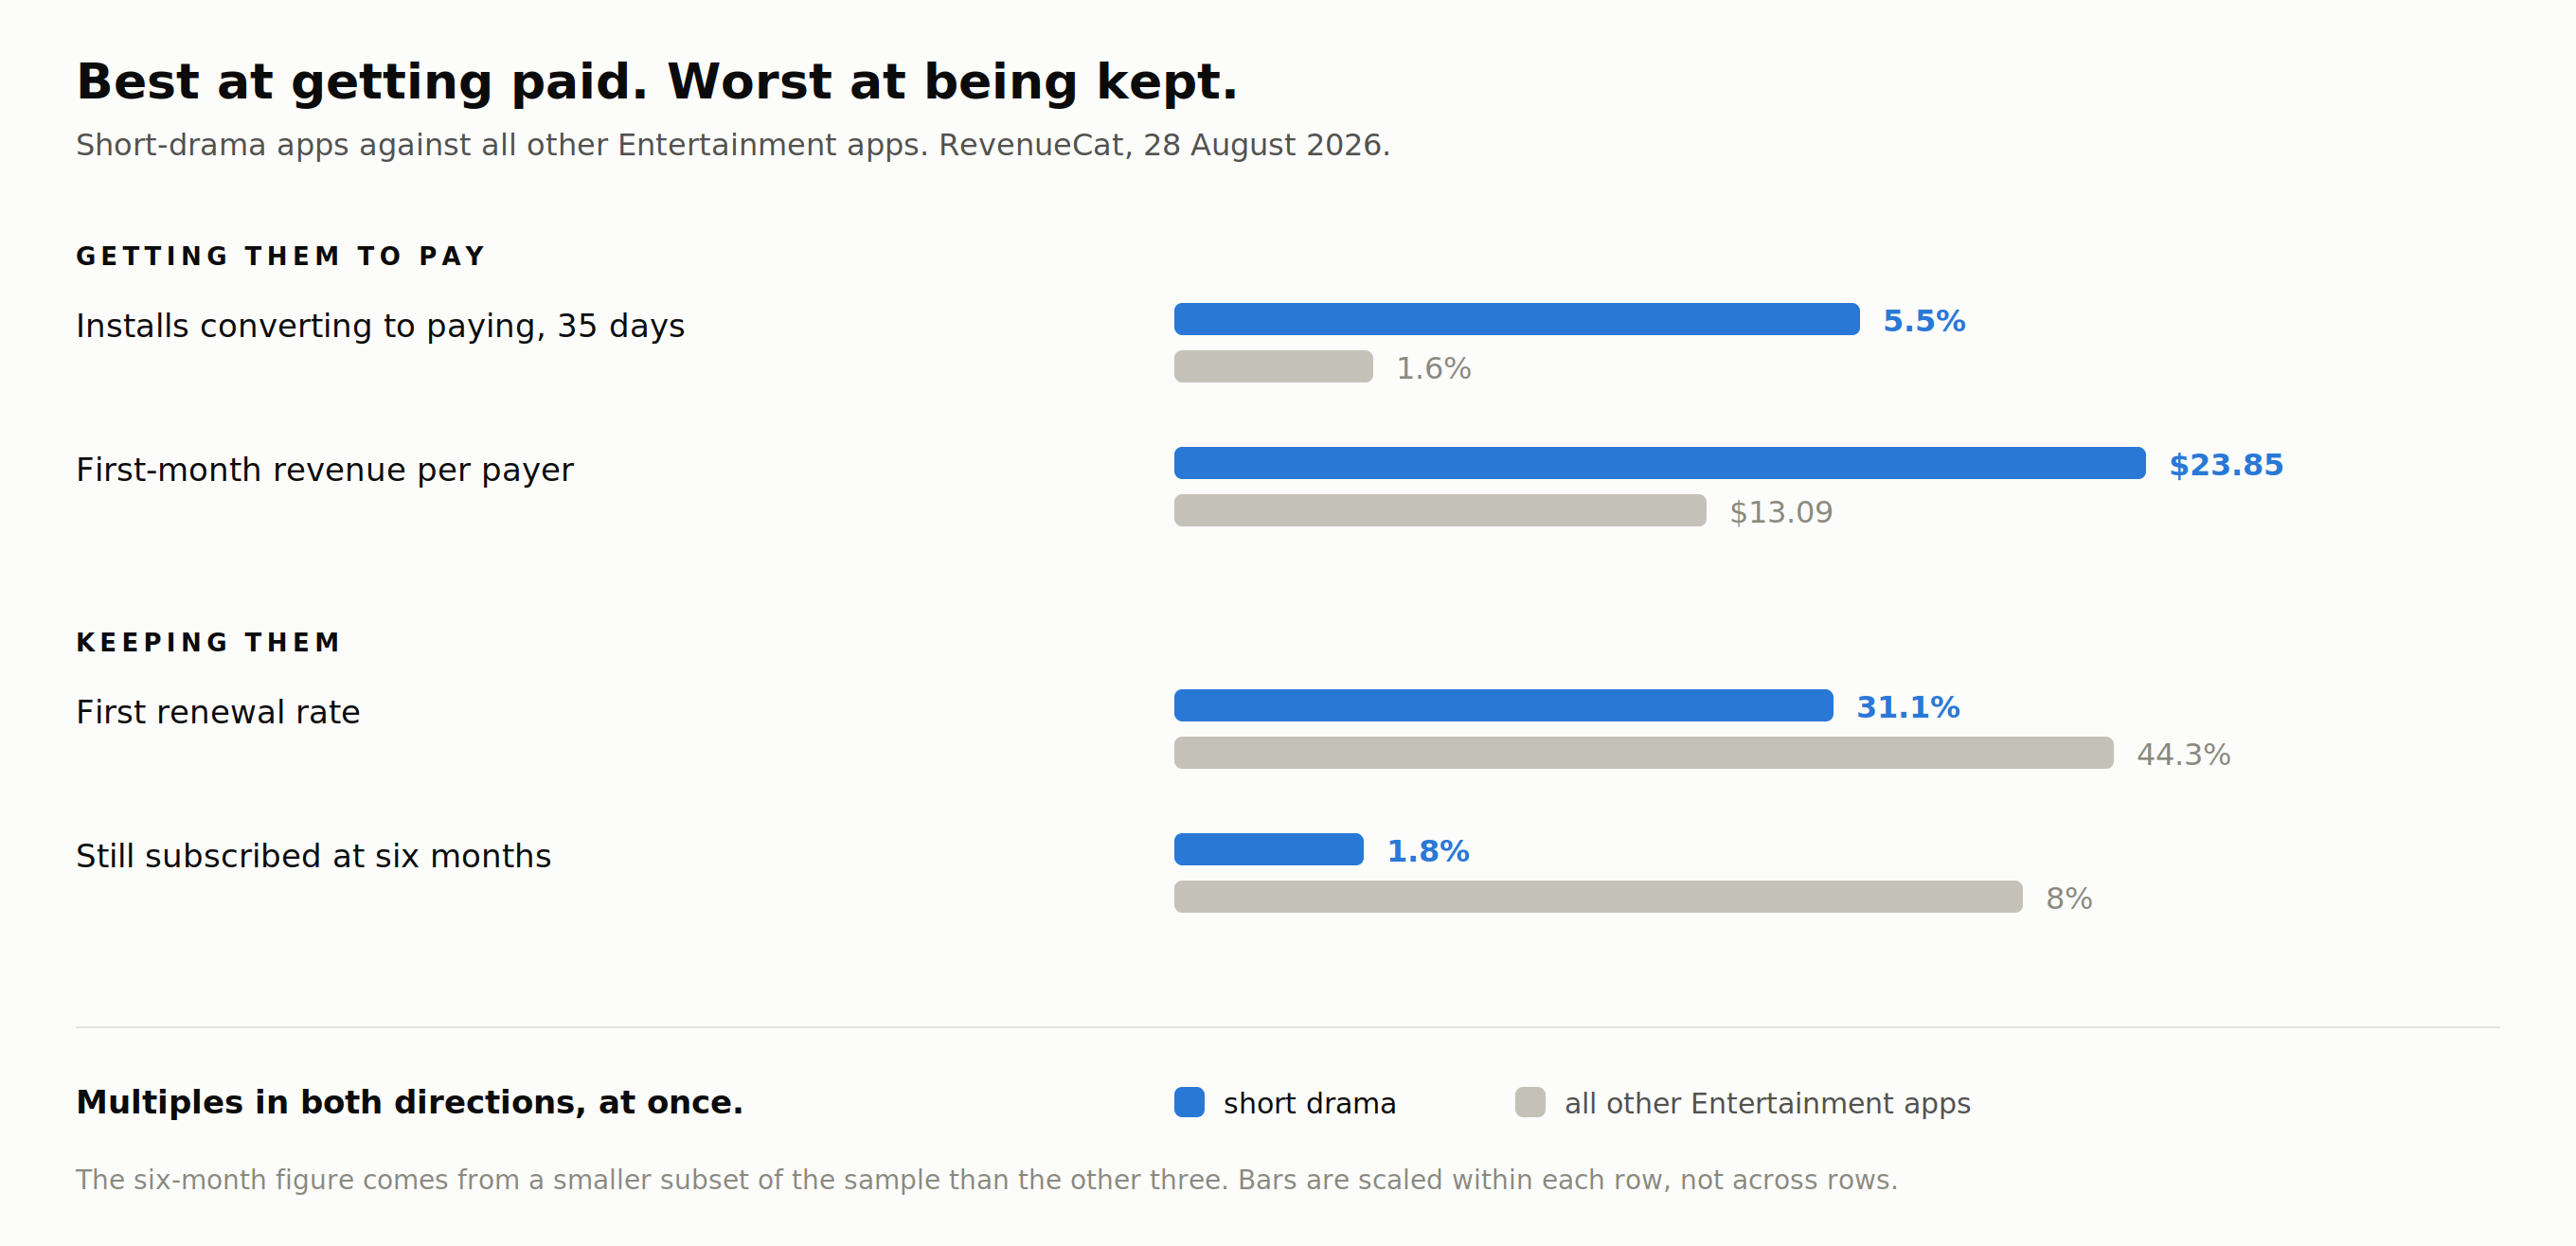 Short drama against all other Entertainment apps. RevenueCat, 28 Aug 2026.
Short-drama apps convert far better than the rest of entertainment. 5.5% of installs became paying users within 35 days, against 1.6% for other Entertainment apps. That is roughly three and a half times better at turning a download into money.
They earn more per payer, immediately. First-month revenue per paying user was $23.85, against $13.09. Nearly double.
And then they lose almost everyone. The median first-renewal rate was 31.1%, against 44.3%. And in the smaller subset where six-month retention could be measured, it was 1.8% for short drama against 8% for the rest of entertainment — a gap I’d flag carefully, because that reduced sample is a real caveat and an insider will notice if you drop it.
Put those four numbers next to each other and you get something you almost never see.
This is a category that is better at acquisition than almost anything else on a phone, and worse at retention than almost anything else on a phone. Not slightly better and slightly worse. Multiples in both directions, at the same time, in the same product.
In part one I guessed at something and had no way to prove it.
I said that a platform which builds against what it can measure will become very good at the part it can measure — keeping you watching, getting you to the moment you pay — and will learn almost nothing about whether you are still there six months later.
Those are two different things. They can pull apart. And when they do, the distance between them is what tells you something is wrong — except that most companies never notice, because the two numbers are collected by different teams and read by different people.
That was a guess about what measurement would show, if anyone ever measured it.
This is what it looks like measured. And the separation is not subtle: the same category that is three and a half times better at getting someone to pay is four times worse at still having them six months later. I expected the two to come apart. I did not expect the gap to be this wide, or to arrive this soon.
So the question is why a product would be brilliant at one thing and catastrophic at the other.
The easy answer is that the content is bad. It might be — plenty of people in this industry think so, and some of them have watched more of it than I have. But that isn’t the argument I’m making here, and I want to be clear about why I’m setting it aside rather than pretending it doesn’t exist. “The content is bad” explains a business that never worked. It does not explain a business that converts three and a half times better than everything around it. Whatever is happening in those first few episodes is working extremely well. If the content were simply bad, it should be failing at that too — and it plainly isn’t.
The quality question is a real one and it deserves its own piece. I’ll come back to it later in this series. For now I want to look at what the product is built to do, because that on its own explains both numbers — the very good one and the very bad one — and you do not need an opinion about the writing to follow it.
It was built for the purchase, not the relationship
The same dataset contains the explanation, and it’s structural rather than editorial.
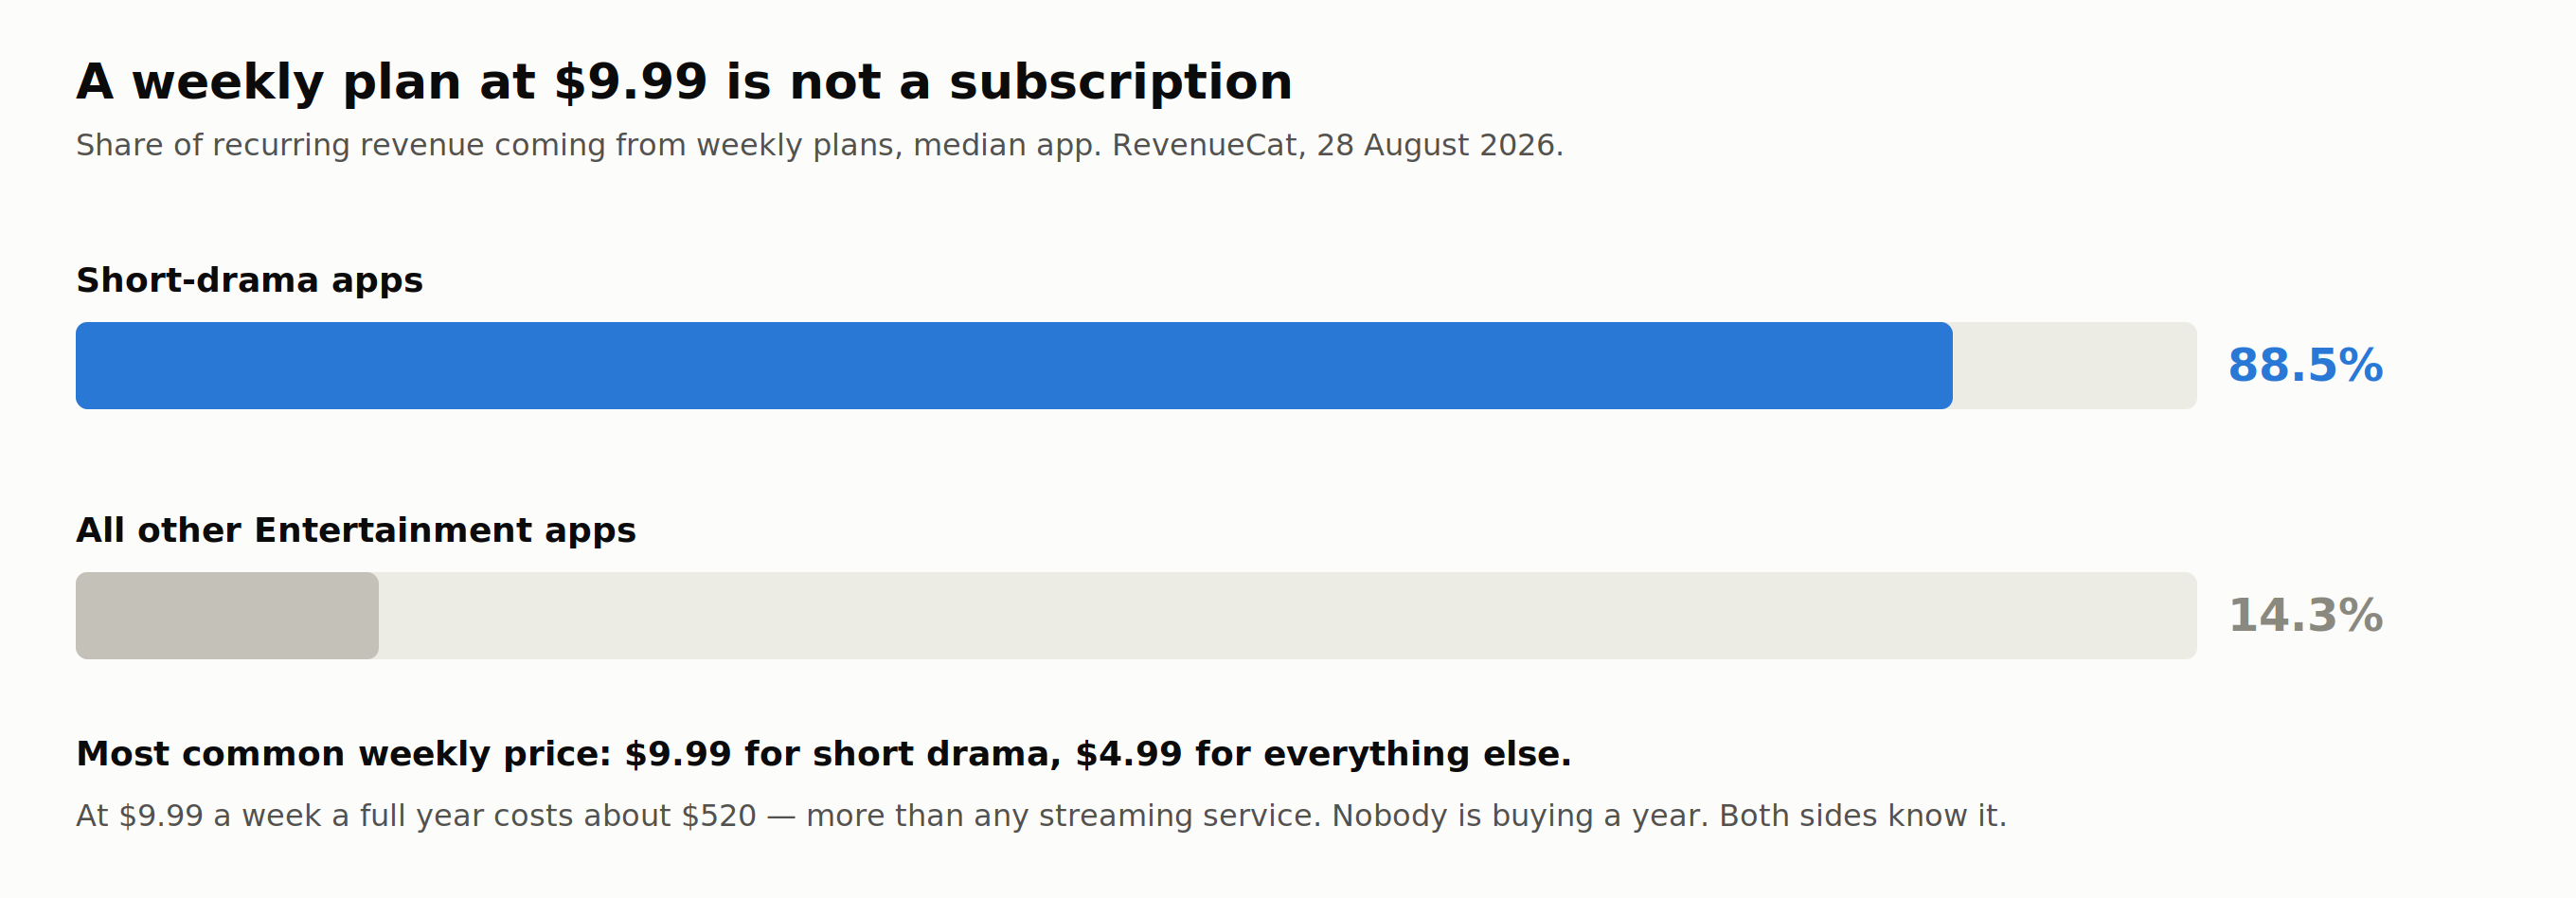 Where the recurring revenue actually comes from.
For the median short-drama app, weekly plans accounted for 88.5% of recurring revenue. For the rest of entertainment, weekly plans are 14.3%.
And the most common weekly price was $9.99 — roughly twice the $4.99 that the rest of entertainment charges for the same cadence.
Read that as a product decision rather than a pricing one. A weekly plan at ten dollars is not a subscription in the way anyone in streaming uses the word. It is a way of charging someone a lot of money for a short, intense burst of consumption that both parties tacitly expect to end. Nobody is building a twelve-month relationship at $9.99 a week; that would be $520 a year, more than any streaming service on earth.
It is called a subscription. In practice it is a single purchase, collected weekly.
And the content is architected to match. The Yale Journal of International Affairs, writing about China’s short-drama export pipeline, describes the mechanism without euphemism: in this format cliffhangers “function as purchase prompts.” The ninety-second episode, the break placed precisely at the moment of maximum unresolved tension, the ten or twenty free episodes before the wall — these are not stylistic choices that happen to sit near a paywall. The paywall is what the structure is for.
None of which is a criticism. It is an extraordinarily effective machine for converting attention into money, and the 5.5% conversion number is the proof. Every element does its job.
The question is what happens when you point that machine at a business that needs month six.
Three businesses wearing one name
Before going further, there’s a complication that has to be got right, because it is the reason this category is so hard to discuss without talking past people.
“Micro-drama platform” describes at least three different businesses.
Some sell unlocks — you buy coins, you spend coins to open the next episode. Revenue arrives per episode, per viewer, per decision.
Some sell access — a weekly, monthly or quarterly pass. Revenue arrives per period.
Some sell attention — free to watch, advertising against it. Revenue arrives per impression.
And most of them, it turns out, sell all three at once. In the RevenueCat sample, more than half of short-drama apps showed all three monetisation types, and those apps accounted for roughly 93% of short-drama store revenue.
You can see the seams from outside. Kuku FM’s own support page states it plainly: “Your subscription does not include VIP Shows. They can only be accessed using coins.” A subscriber who assumed subscribing meant access has already met the second business.
I am not saying that’s wrong. Running multiple revenue models is normal and often correct.
What I’d say is that these three businesses want different content, and the format currently gives them all the same content.
An unlock business wants a title engineered around its pay-points, because that’s where revenue lives. It should optimise ruthlessly for the moment someone decides to spend.
An access business wants a catalogue that gives someone a reason to still be there in eight weeks. Individual pay-points are irrelevant; what matters is whether the whole thing sustains.
An advertising business wants time on screen, which is a third objective again.
The grammar of the format — the ninety seconds, the cliffhanger, the wall — was built for the first one. It is being used by all three.
So does anyone inside the category say this out loud?
Yes. In June, and while shutting a product down
Pocket FM is one of the larger audio-and-serialised-story companies to come out of India. In June it closed Pocket TV, its micro-drama product, after a five-month beta.
Its co-founder and CEO Rohan Nayak wrote about why, publicly, on LinkedIn. Three things he said are worth quoting exactly, because they are an operator’s account rather than an outsider’s theory.
On the problem:
“User acquisition isn’t the challenge in micro drama today, long-term retention is.”
On what they found in their own product:
“The hardest part wasn’t getting people to try the product; it was getting them to come back.”
And the sentence that has been quoted most since:
“If your business only works because cancelling is intentionally difficult, you don’t have product-market fit, you are a marketing arbitrage platform.”
He also said plainly that “we don’t think the current micro drama model works.”
I want to be careful with this. Nayak runs a company that competes in the same category, and a competitor’s assessment is not neutral evidence. Take it as one operator’s testimony, sitting alongside a dataset that says the same thing from a completely different direction — and note that he is describing a product he built and closed, not somebody else’s.
The reason his account is worth the space is that it matches the numbers precisely. Acquisition was never the problem. 5.5% conversion is not a problem. The problem is 1.8%.
But testimony and correlation are still not causation. A category could convert well and retain badly for reasons that have nothing to do with how its content is designed — price, competition, novelty wearing off.
So is there any actual evidence that optimising for the conversion moment causes worse retention?
There is, and it comes from games
The cleanest evidence I’ve found isn’t from streaming at all. It’s a field experiment published in the International Journal of Research in Marketing in 2025, by Eva Ascarza, Oded Netzer and Julian Runge.
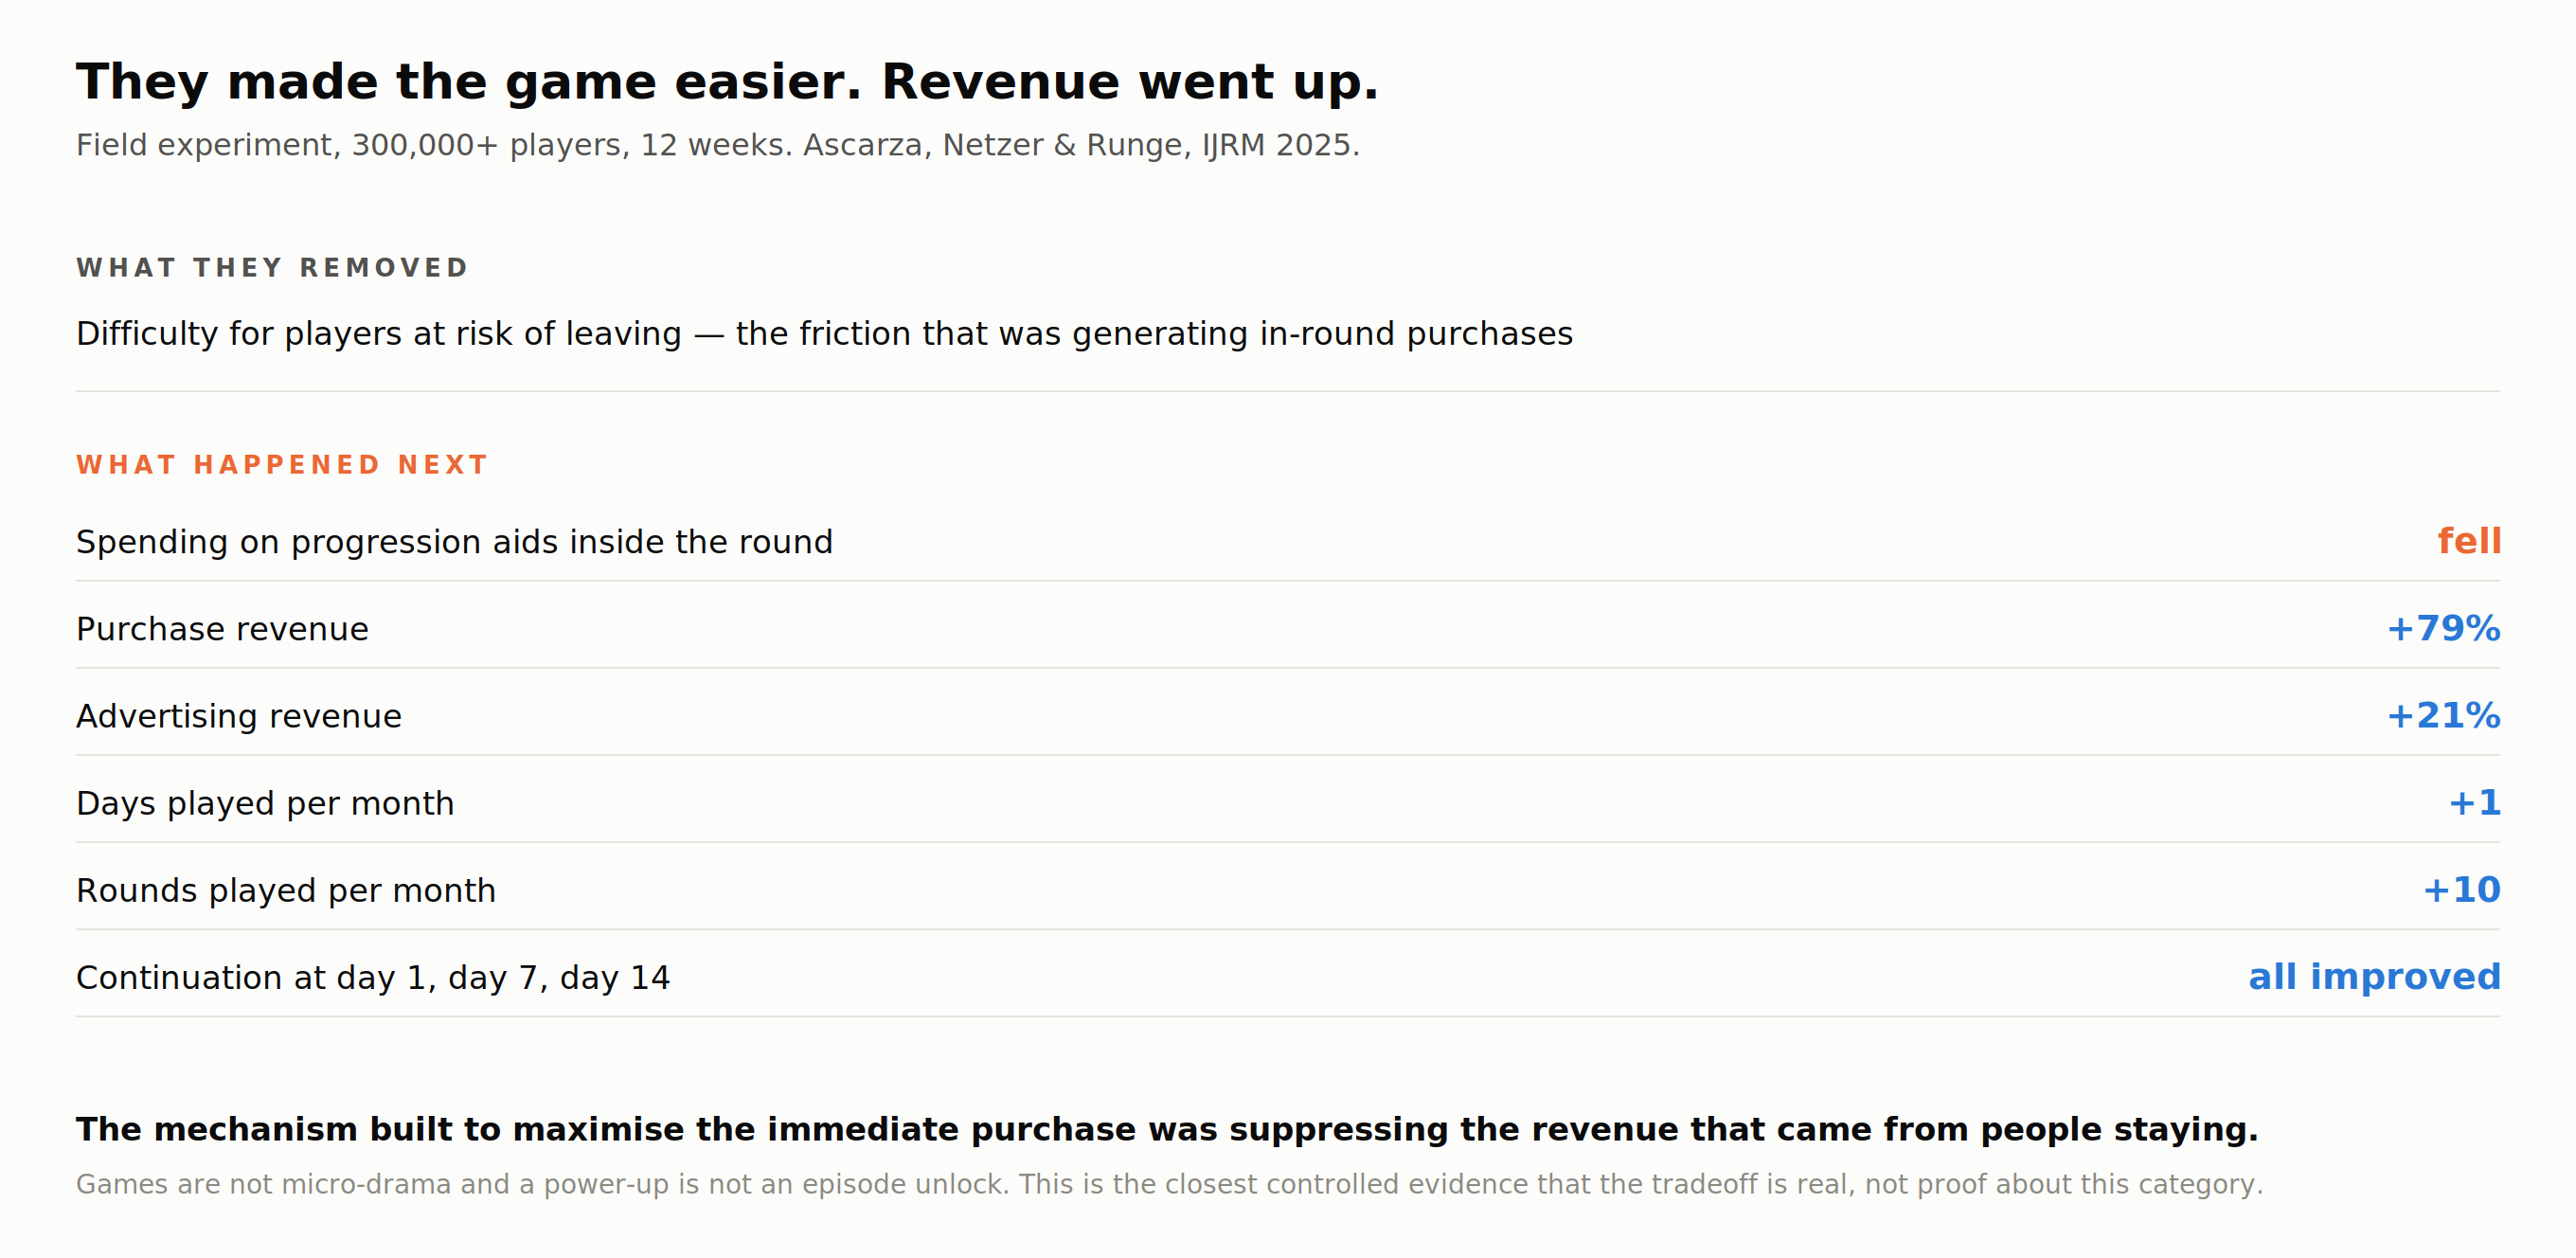 The field experiment that made the game easier.
Here is the setup in plain terms. In a free-to-play mobile game, players who are struggling are the most likely to spend — they buy the power-up, the extra life, the progression aid, precisely at the moment of frustration. Difficulty is, in effect, a conversion mechanism. The moment of maximum friction is the moment of maximum revenue.
The researchers took over 300,000 players and, for twelve weeks, made the game easier for those at risk of leaving.
The immediate effect was exactly what you’d fear: spending on progression aids inside the round went down. They had removed the friction that was generating the purchase.
And the total result was that purchase revenue rose 79%, advertising revenue rose 21%, players played about one more day and ten more rounds a month, and continuation rates at day one, day seven and day fourteen all improved.
The mechanism designed to maximise the immediate purchase was suppressing the revenue that came from people staying. Removing it cost them the transaction and won them the customer, and the customer was worth far more.
That is a controlled experiment, in a different industry, with a large sample — which is both its strength and its limit. Games are not micro-drama and a power-up is not an episode unlock. I’m offering it as the closest available evidence that this class of design tradeoff is real and measurable, not as proof about this category.
Now the part where I try to take my own argument apart.
The strongest case against everything above
If I only presented the evidence that agrees with me, this would be advocacy. Here is what genuinely cuts the other way, and some of it is substantial.
Price, not content, is the main reason people cancel. Parks Associates, surveying 8,000 US internet households, found the top cancellation reason is cutting household expenses — around 30% — and that ad-supported tiers now outpace content exclusivity as a retention lever. Deloitte’s 2025 Digital Media Trends found 60% of subscribers would likely cancel over a $5 increase. If price dominates, slate composition is a second-order effect and I am over-weighting it.
Bundling swamps everything I’ve described. Antenna’s 2025 data shows twelve-month survival of 59% for bundled subscriptions against 28–33% for the same services standalone, with the gap roughly doubling between month one and month twelve. That is a structural lever an order of magnitude larger than any content effect anyone has measured. If you want retention, the evidence says bundle before you re-think your slate.
Individual hits do retain — and it has been measured. Antenna tracked the people who watched The Pitt on HBO Max and asked a simple question: a month after the final episode aired, how many of them still had a subscription?
The answer was 75%, against a benchmark of 67% for viewers of comparable shows. In plain terms: out of every hundred people who watched it, roughly eight more stayed than would normally have stayed. One show, one measurable difference in whether people kept paying.
So “commission fewer, bet bigger, chase the hit” is not a lazy strategy. It is a strategy with at least one piece of hard evidence behind it, and any argument for slate breadth has to sit alongside that rather than ignore it.
And churn may not be the disaster it looks like. This is the counter-argument I find hardest to dismiss, and it turns on how you read one number.
Antenna found that 42% of people who cancelled a streaming service in 2024 had resubscribed to that same service within twelve months. For Netflix specifically the figure was around 50%.
Here is how to read that. Take a hundred people who cancel Netflix. Within a year, roughly fifty of them are paying again. So for Netflix, a cancellation is very often not a loss — it is a pause. Someone finishes the show they came for, stops paying for a few months, and comes back when something else arrives.
Which means the churn number, read literally, badly overstates what the business actually loses. Netflix can live with a cancellation rate that would look terminal at a company where leaving meant leaving.
Now apply that to micro-drama. If the same thing happens there — if the person who lapses after six months comes back for the next title that catches them — then 1.8% six-month retention is describing something less alarming than it sounds. You would not have a retention business. You would have something closer to how cinema works: nobody “churns” from the cinema, they just go when there’s something to see. Acquire cheaply, monetise hard at the moment of interest, reacquire later. That is a coherent model, not a broken one.
Two things stop me being persuaded. Nobody has published resubscription data for micro-drama, so we do not know whether it behaves like Netflix or not — that is an open question, not a settled defence. And reacquisition only works if buying the same person back is cheaper than keeping them, which in a category spending heavily on user acquisition is exactly the thing that would need proving.
And the last one is the most awkward for me, so it’s worth going slowly.
My argument leans on the idea that sameness across a catalogue drives people away — that twelve titles resolving the same way is what makes month six feel unnecessary. The obvious fix is to commission a more varied slate, which is expensive and slow.
There is research suggesting the fix might be neither.
Joseph Redden, writing in the Journal of Consumer Research, studied satiation — the ordinary business of getting bored of something you liked at first. In his experiments people ate jelly beans. One group was shown them sorted simply, by colour. Another group was shown the identical sweets sorted into finer, more specific categories — cherry, lemon, lime rather than red, yellow, green.
The second group got bored more slowly. Same sweets. Same actual variety. Only the labelling changed.
What slowed the boredom was the perception of variety, not variety itself.
Now translate that. Two platforms each hold two hundred micro-dramas, and the two hundred are equally similar to one another. The first puts them all under one heading: “Micro-drama.” The second breaks them into office revenge, second-chance romance, small-town thriller, and so on — the same two hundred titles, sorted into narrower groups. If Redden’s finding carries, the second platform’s audience may tire of the catalogue more slowly than the first’s — with no difference whatsoever in what was commissioned.
Which is genuinely uncomfortable for my case. It raises the possibility that some of what looks like a commissioning problem is a merchandising problem — and merchandising is enormously cheaper to fix than a slate.
None of these kills the argument, but each takes a piece out of it, and I want to be exact about how much.
Price and bundling are real and they are large. They are also levers you pull alongside slate decisions, not instead of them. Bundling changes how many people stay; it does not change what you commission next month, and a platform with no bundle partner and no room to cut price still has to decide what to make.
The hit evidence is one show, on one platform, in one market. The Pitt moved a number by eight points. That is a real finding and it is a sample of one, and I would want to see it repeated before I built a slate strategy on it.
The satiation research is the one that genuinely constrains me. If perceived variety does much of the work, then the cheap fix should be tried first — reorganise the catalogue, break it into narrower and more specific groupings, and see whether the retention curve moves — before anyone spends money commissioning differently. That is a better sequence than the one my argument implies, and I would take it.
The churn-and-return case stays open until somebody publishes resubscription data for this category, and nobody has.
So I hold the position, and I hold it more loosely for having written this section. If you want to argue with me, start here rather than with the parts that agree with me.
Which brings this home.
What this looks like in India
The Indian numbers make the tension sharper, not softer.
 The Indian market, 2025. FICCI-EY.
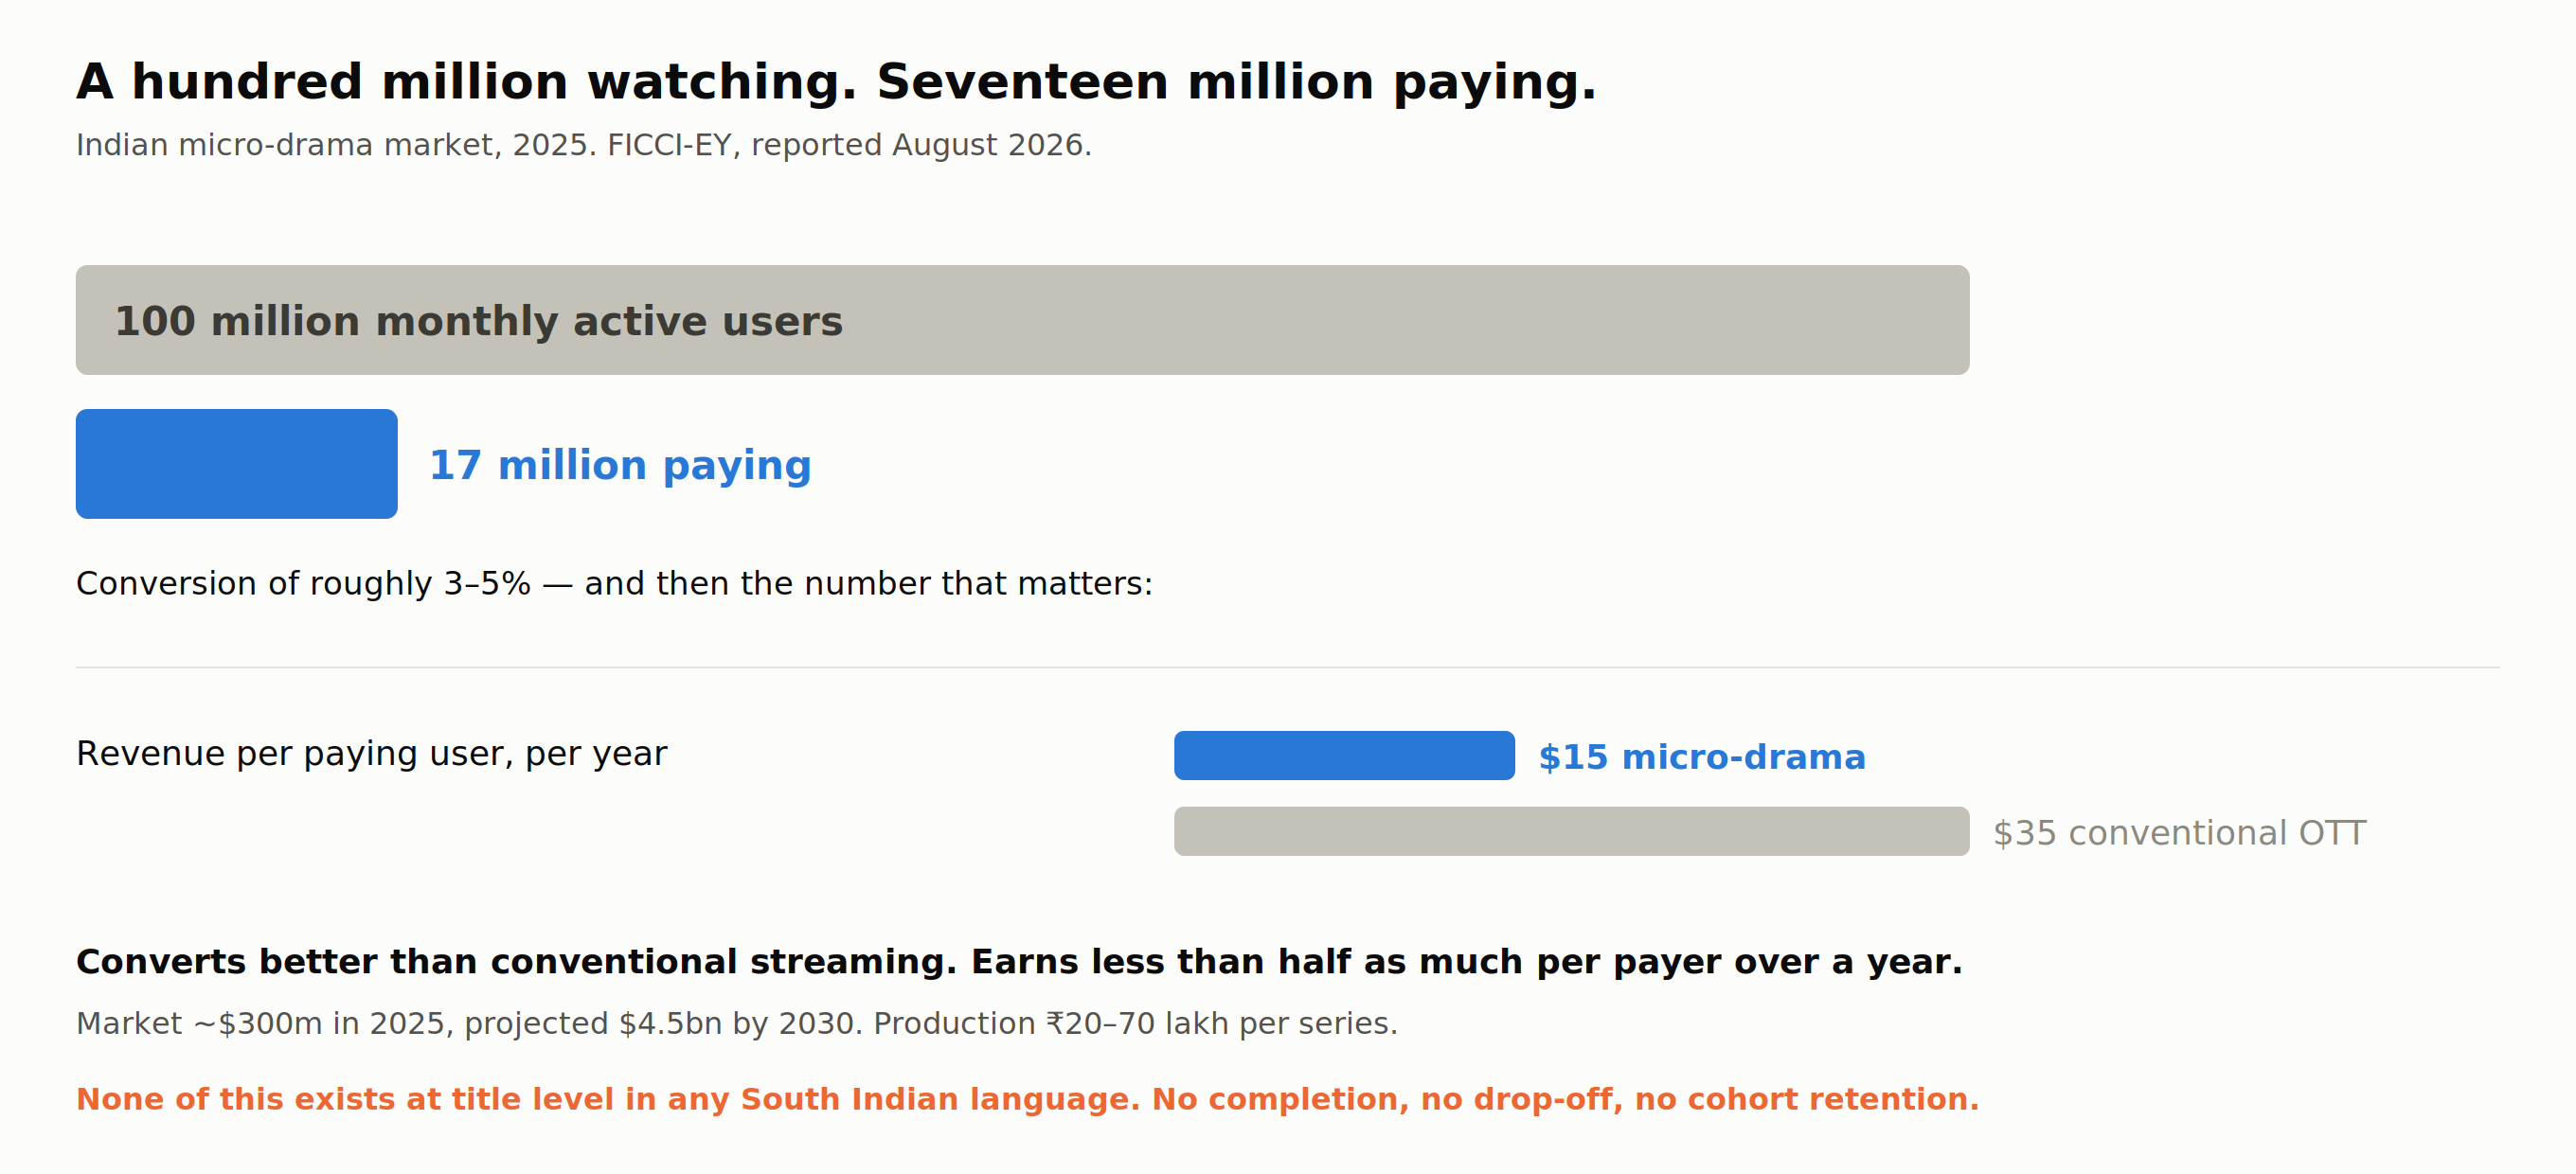
FICCI-EY’s 2026 assessment, reported in August, puts the Indian micro-drama market at roughly $300 million in 2025 — about ₹2,500 crore. That is small. It is a rounding error against Indian media and entertainment as a whole.
The audience number is not small at all. About 100 million people watch micro-drama in India in a given month. That is genuine mass scale — the kind of monthly reach an established streaming platform would recognise.
Seventeen million of them pay. So roughly three to five people in every hundred who watch will hand over money, and ninety-five or more never will.
The production figure is where it starts to make sense. A micro-drama series costs somewhere between ₹20 lakh and ₹70 lakh — for the entire series. A long-form Indian original costs ₹25 lakh to over ₹1 crore per episode. You can make a whole micro-drama series for less than one episode of the thing it is competing with for attention. That is why the volume exists, and it is a completely rational response to the economics.
And the projection is $4.5 billion by 2030 — roughly fifteen times the current market inside five years. That is the number the investment is being made against.
But one figure in the set is the one I’d put on the wall.
Average revenue per paying user is around $15 a year, against roughly $35 for conventional OTT.
Micro-drama converts better than conventional streaming and earns less than half as much per payer over a year. Both halves of that are consistent with everything above: excellent at the transaction, poor at the relationship.
Now set that against what the category has committed to. One platform has publicly promised more than a thousand South Indian originals by March 2027. Others are releasing a couple of hundred titles a month. Omdia estimated the global market at $11 billion in 2025.
And then there is the Chinese comparison, which is the one that tends to stop people.
In 2024, micro-drama revenue in China reached RMB 50.4 billion — around $7 billion. In the same year, the entire mainland Chinese theatrical box office came to RMB 47 billion.
Box office here means what it sounds like: every ticket sold, for every film released in Chinese cinemas, across the whole year. All of it. The Chinese film industry’s total ticket revenue.
A format that barely existed five years earlier out-earned it.
I am not offering that as a prediction for India, where the market is a fraction of the size and the economics are different. I am offering it as the reason this is not a small experiment. It is one of the largest content-production build-outs happening anywhere, and the unit economics underneath it currently show a business that is superb at getting someone to pay once.
And here is the part specific to where I work. In Telugu, Tamil, Kannada, Malayalam and Bengali, none of the numbers above exist at title level. Nobody publishes completion. Nobody publishes drop-off. Nobody publishes cohort retention. The RevenueCat data is global and app-level; the FICCI-EY data is market-level. Between the two there is a gap exactly the size of a commissioning decision.
So the question isn’t whether these figures apply to a Telugu slate. It’s that nobody can currently know, and every platform in the language is commissioning as though somebody does.
What I’d watch, if it were mine
Not answers. These are the things I’d instrument first, and in this order.
The gap, tracked as one number. Completion and cohort retention on the same chart, reported to the same person, on the same cadence. Part one’s argument was that most operations can’t see the divergence because the two numbers live in different reports. This is the cheapest fix available and almost nobody does it.
Renewal at the second period, not the first. First renewal is where 31.1% shows up. But the interesting decision is the second one — the point where somebody has finished the thing they came for and is deciding whether this is a service or a purchase. That number is where a subscription business either exists or doesn’t.
Performance split by monetisation route. If a platform runs unlocks and passes and advertising at once, then titles are being asked to do three different jobs, and nobody currently reports which titles are good at which. That split would settle more arguments than any amount of genre analysis.
And whether repetition shows up anywhere in the data at all. Sameness across a catalogue is not an event inside any single title, so no per-title metric can register it. If you believe it matters, you have to build a measurement for it deliberately — and if you can’t, you should be honest that you’re operating on faith there.
Where this goes next
Part one argued something fairly abstract: that data can tell you how to make a thing and how to be less wrong about it, but not what to make — because the part of the signal that decides the outcome is the part nobody captures.
Part two is the same argument with a number attached.
A format can be built so well around one moment — the moment someone decides to pay — that it becomes structurally poor at everything that comes after that moment. Not because the people making it are careless, and not because the content is bad. Because every incentive, every metric and every piece of the product’s architecture points at a decision that happens in the first ten minutes, and almost nothing points at whether that person is still around in month six.
The reason I can write that now rather than assert it is that somebody finally published both halves of the number. 5.5% against 1.6% on one side, 1.8% against 8% on the other. That moves this out of the realm of taste and into the realm of things you can check — which is the only kind of argument worth making about a business this big.
What I’ve deliberately left alone: how you’d actually define a title’s attributes precisely enough to learn anything from them, which is where most measurement attempts quietly die. What a first-party stack should contain and the order to build it in. And the question I find most interesting, which is what all of this means for writers and writers’ rooms — because every argument above eventually lands on somebody being asked to write to a metric.
Those are the next ones.
Karthik Vamsi Tadepalli built the content function at aha and has spent the last year researching the vertical micro-drama market in Telugu.