Data-driven commissioning · Part 1
Data Won't Tell You What to Make
What data-driven commissioning actually is, what it isn't, and what you do when the data doesn't exist. Part one of a series.
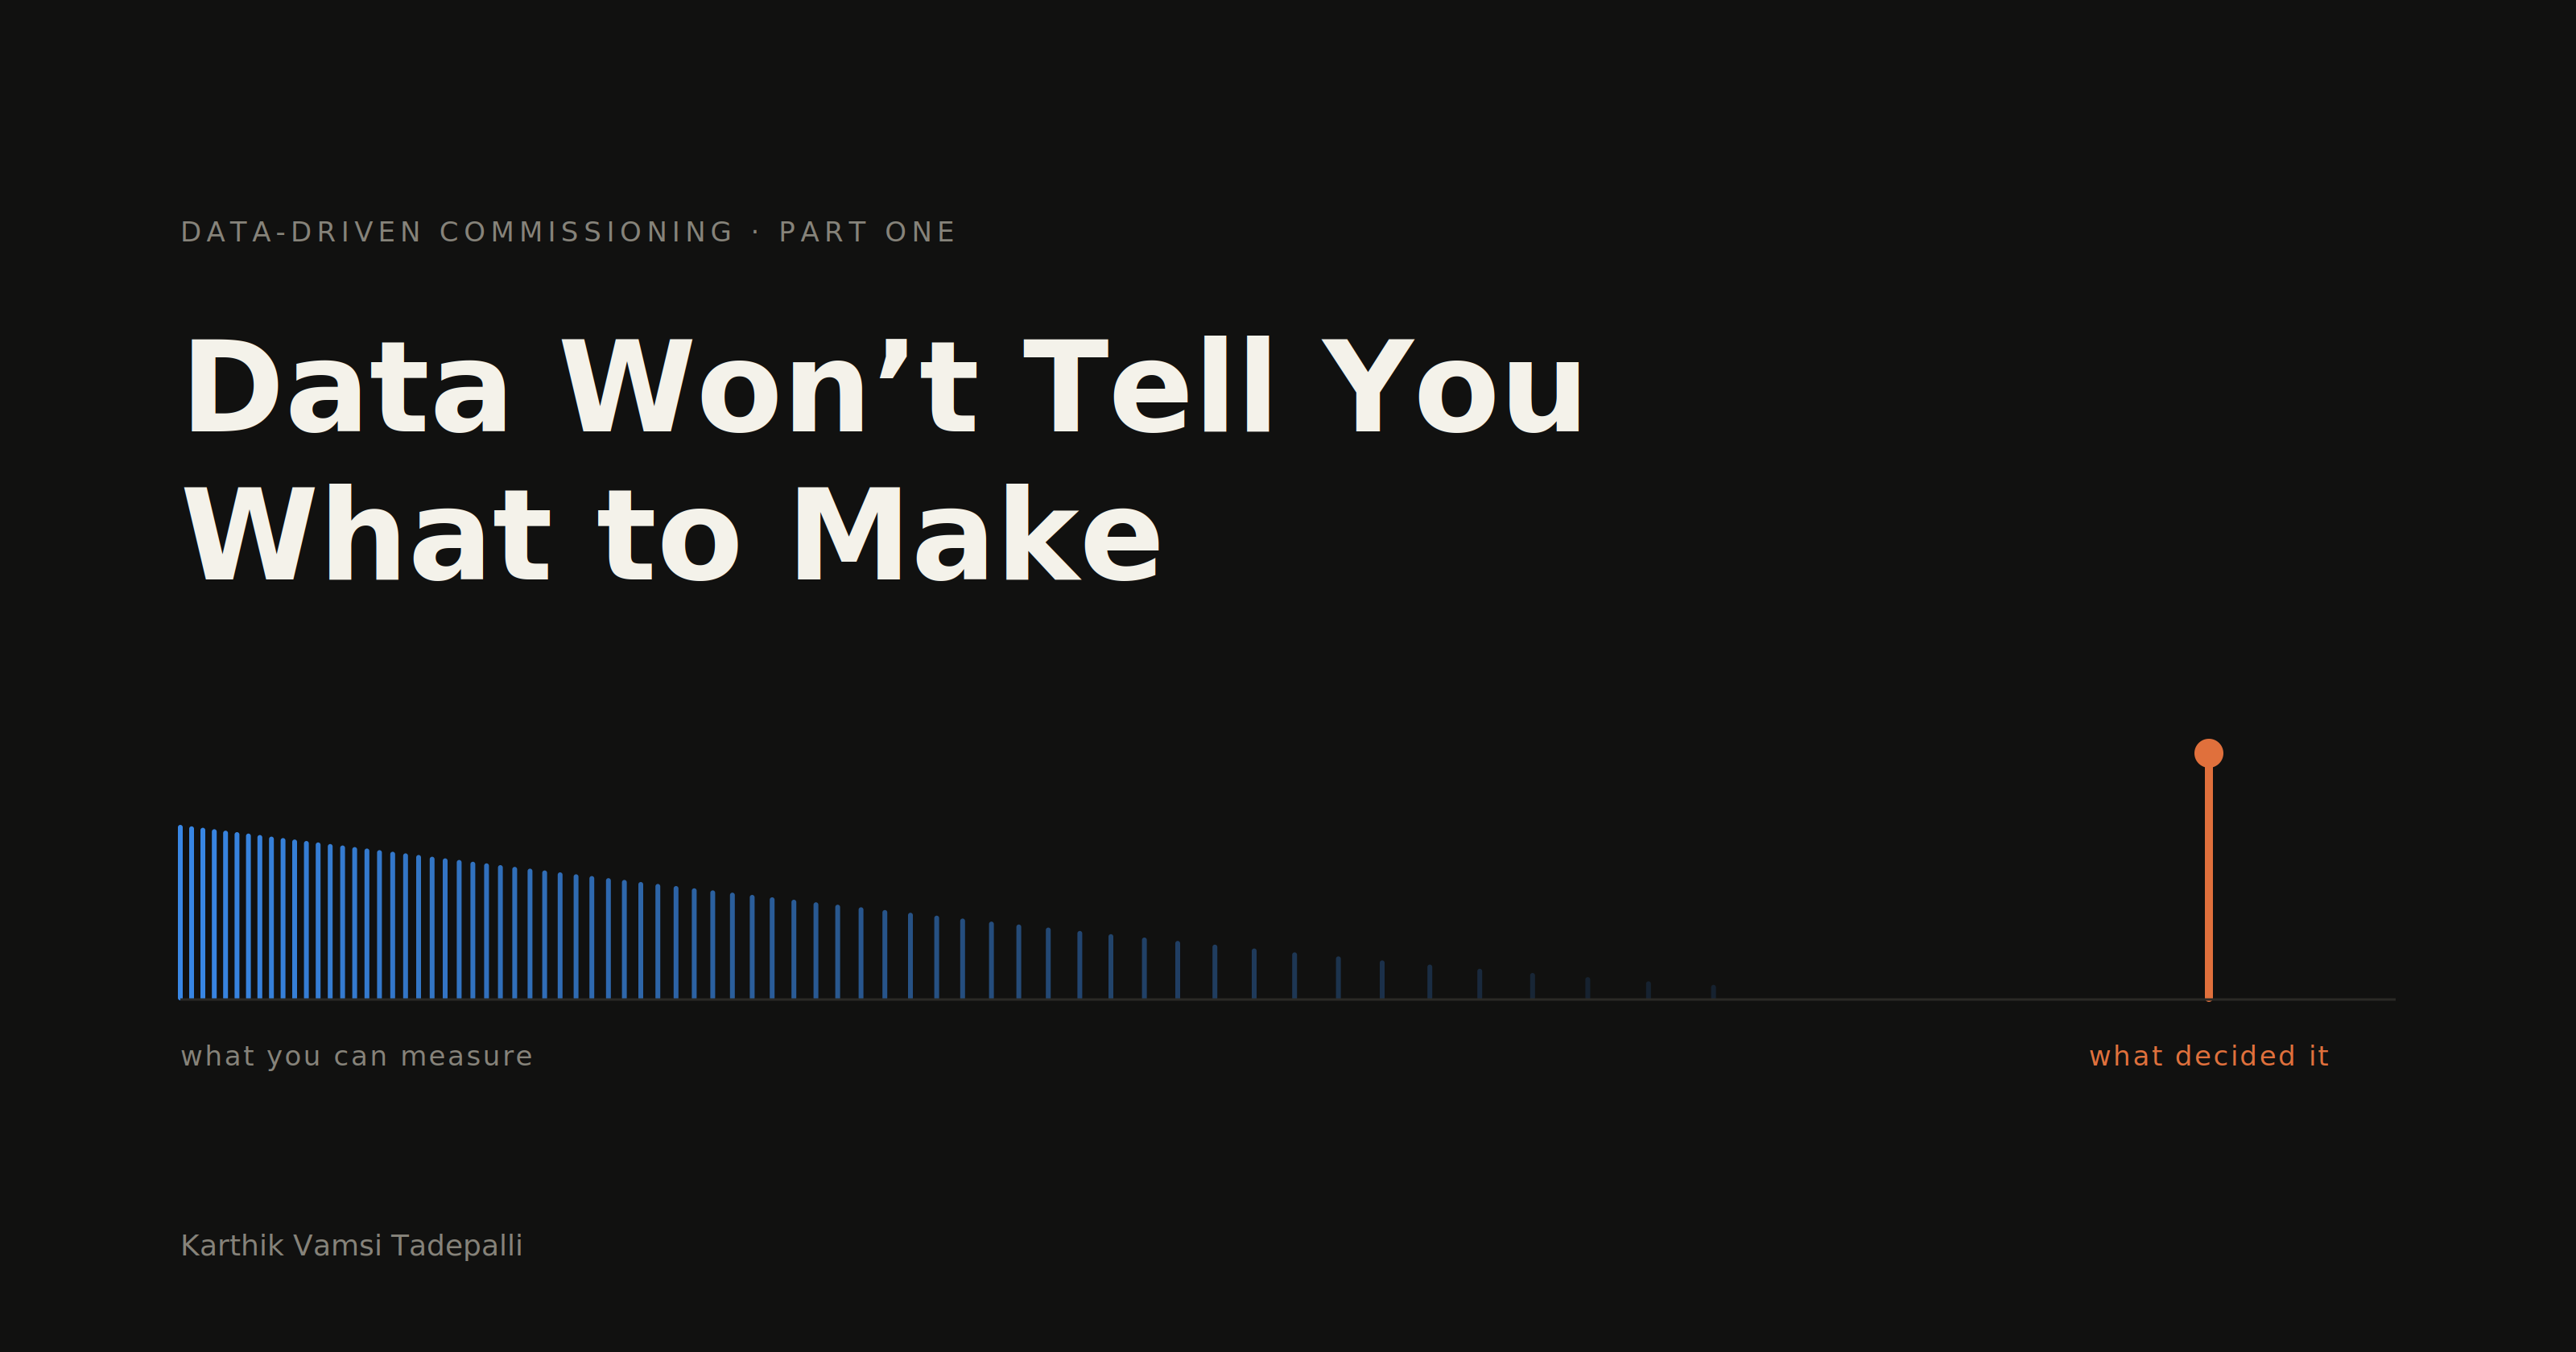
Commission ten titles. Seven or eight of them will not return what they cost. One or two will carry the rest, and one of those may carry everything.
That is not a bad year. That is the ordinary result, in every format and every language anyone has tried it in. In my experience of commissioning, and in every catalogue I have seen the inside of, it holds. Nobody publishes the number, which is itself part of the problem — but I have never met a commissioner who would argue with it.
Everyone in the industry knows this. Almost nobody organises around it.
Instead, the conversation about data in content is framed almost entirely as hit-picking: which show will work, which face will travel, which genre is next. That framing quietly assumes the job is to raise your chances of being right.
But if seven in ten are going to fail whatever you do, raising your chances of being right is not where the money is. The useful job is to be less wrong, less often, and less expensively — to lose smaller on the seven, and to find out sooner which ones they are.
Those are different jobs and they need different instruments. Statisticians call the seven-in-ten figure a base rate — how often a thing happens across all cases, before you know anything about the particular case in front of you. Hold onto that idea. It comes back at the end, and it turns out to be the single most useful thing you can know when you have no other data.
That distinction is what this piece is about. It runs long, and it still won’t finish the subject.
What “data-driven commissioning” actually covers
The phrase gets used as though it names one activity. It covers three, and they happen at different moments with different information available.
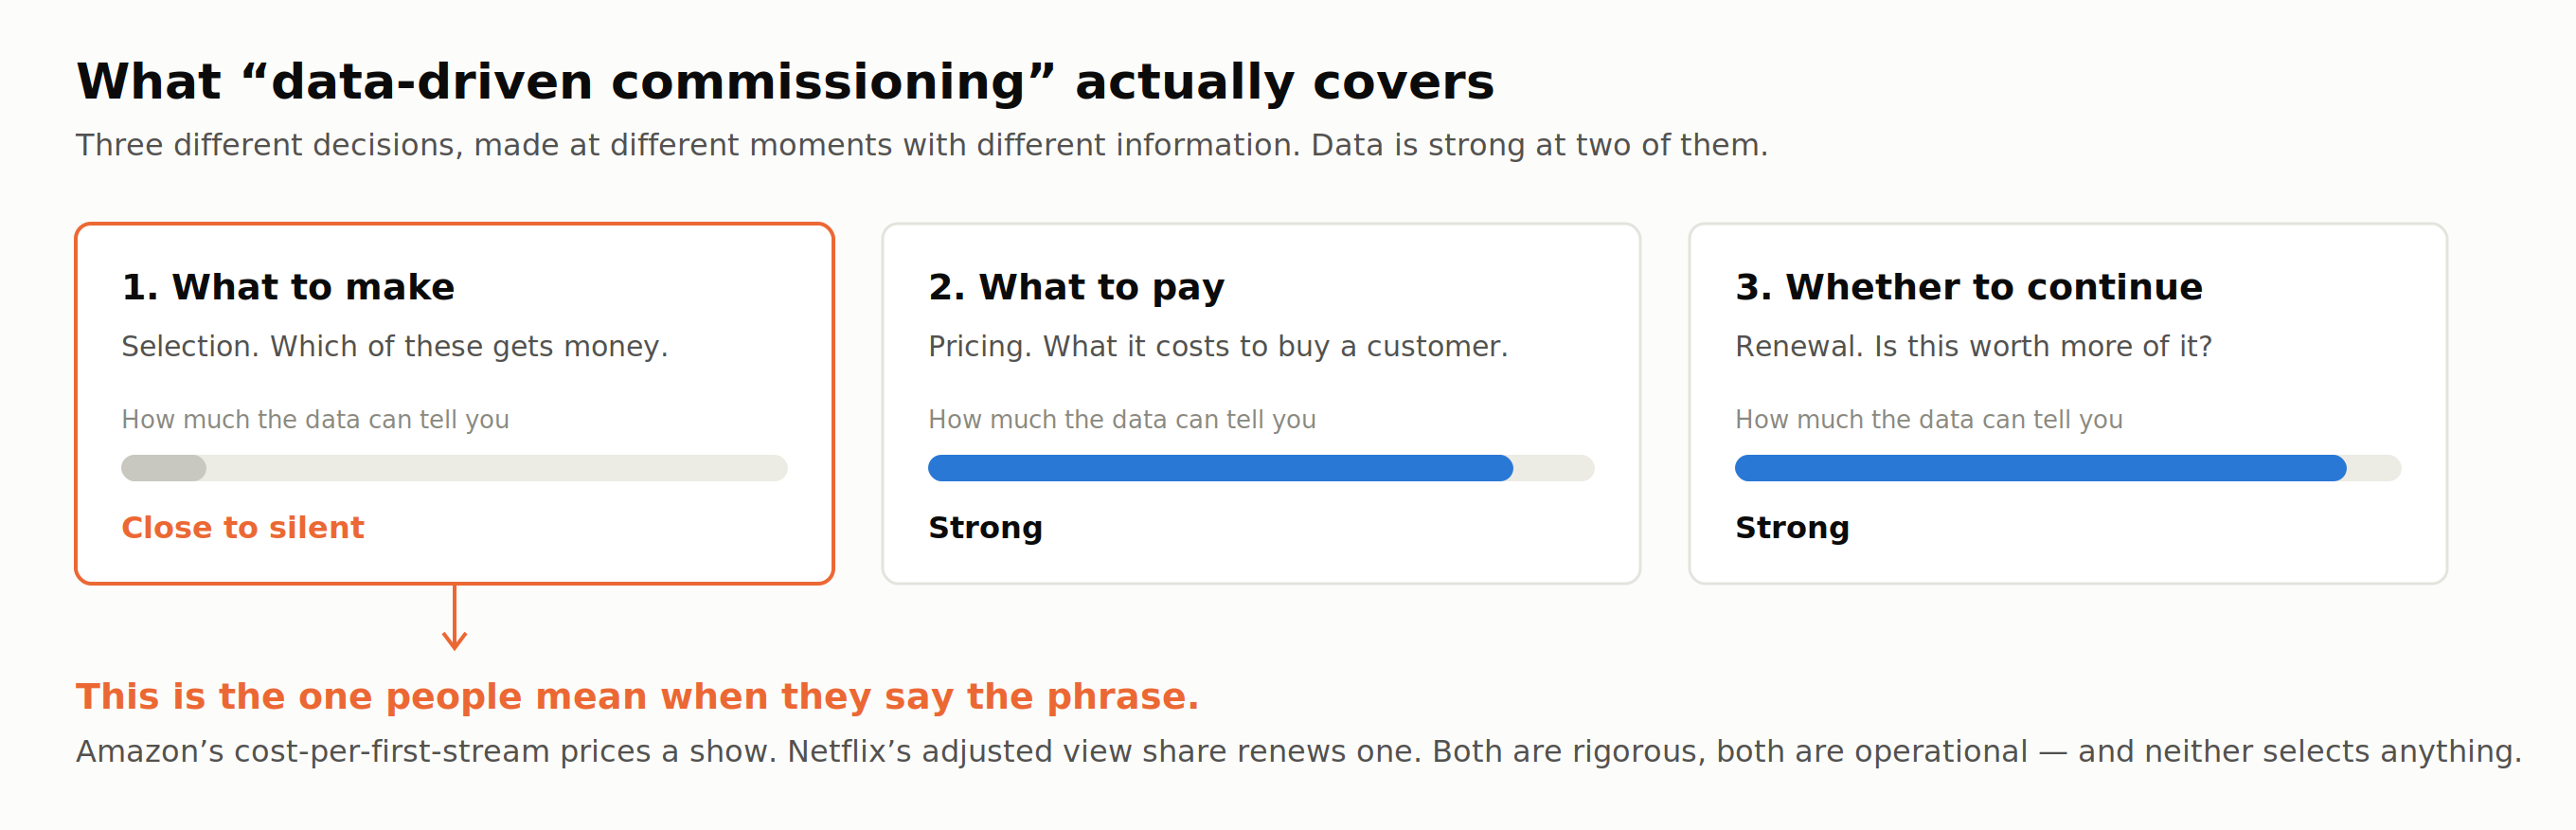 The three decisions the phrase covers.
One: what to make. Selection. Which of the things in front of you gets money.
Two: what to pay for it. Pricing, budgeting, how much of the slate it consumes.
Three: whether to continue. Renewal, second season, more of that kind.
Data is genuinely powerful at the second and third. It is close to silent at the first. And when people say “data-driven commissioning,” they almost always mean the first.
It’s worth seeing how good the instruments for two and three actually are, because the contrast is the whole point.
Amazon prices a show as a customer-acquisition instrument. Internal documents reviewed by Reuters in 2018 describe a metric called cost per first stream: take the first season a new Prime member watches, and divide what it cost to make and market by the number of members whose first stream it was. That is not a measure of how good the show is or how many people watched it. It is a measure of what it cost to buy a customer. (summary · Quartz)
Netflix does something more sophisticated on renewal. Internal figures reported by Bloomberg in 2021 show a metric called adjusted view share, which weights a view by who did the watching. A view by a long-standing heavy user counts for less; a view by someone new, or someone who had nearly stopped watching, counts for more — on the reasoning that for that person, this show is why they haven’t cancelled. That gets converted into a dollar figure, and then set against the production budget as an efficiency multiple. Squid Game, made for around $21.4m, returned more than forty times its cost on that measure. (Variety, on the Bloomberg documents)
Both are rigorous. Both are operational. Neither one selects anything. They price and they renew.
And the people running the largest content-data operation in the world have been fairly consistent about this.
Ted Sarandos was reported in 2015 as describing the balance as “70 percent data and 30 percent human judgment.” By 2018 he had reversed it, on the record: “It’s 70 percent gut and 30 percent data.” Bela Bajaria, Netflix’s content chief, put it flatly at UCLA: “Algorithms don’t decide what we make… there’s not an algorithm that would probably say, you know what’s a great idea? A period show about a woman playing chess.” (Variety)
And on their biggest title of the decade, Sarandos said nothing in the data suggested it would work: “If anybody made big creative decisions based only on data, that would be a fool’s errand.” (TVLine)
The founding myth is worth correcting
Almost every conversation about this eventually reaches House of Cards, and the story that Netflix’s algorithm greenlit it. That story came from the press in 2013, not from Netflix.
Two things are usually left out. Netflix did not develop the show — it bought the rights to an existing property, in a competitive bidding process, against other buyers. And the part of the process reported to have been genuinely data-driven was marketing: Netflix is said to have cut different trailers for different audience segments, showing people the version most likely to land with them. Netflix has never confirmed the detail.
The academic reading of this is that the platform benefits from the ambiguity — it gets to appear data-driven to investors and creative-led to filmmakers, without disclosing which it is. (Tryon · van Es, Television & New Media)
So if data doesn’t pick, what does? And more usefully: why can’t it?
The part that never enters the log
Here is what a modern content system knows about a viewer who abandoned an episode.
It knows they stopped at seven minutes and twelve seconds. It knows what they watched before, what device they were on, what time it was, whether they came back, and what they watched next.
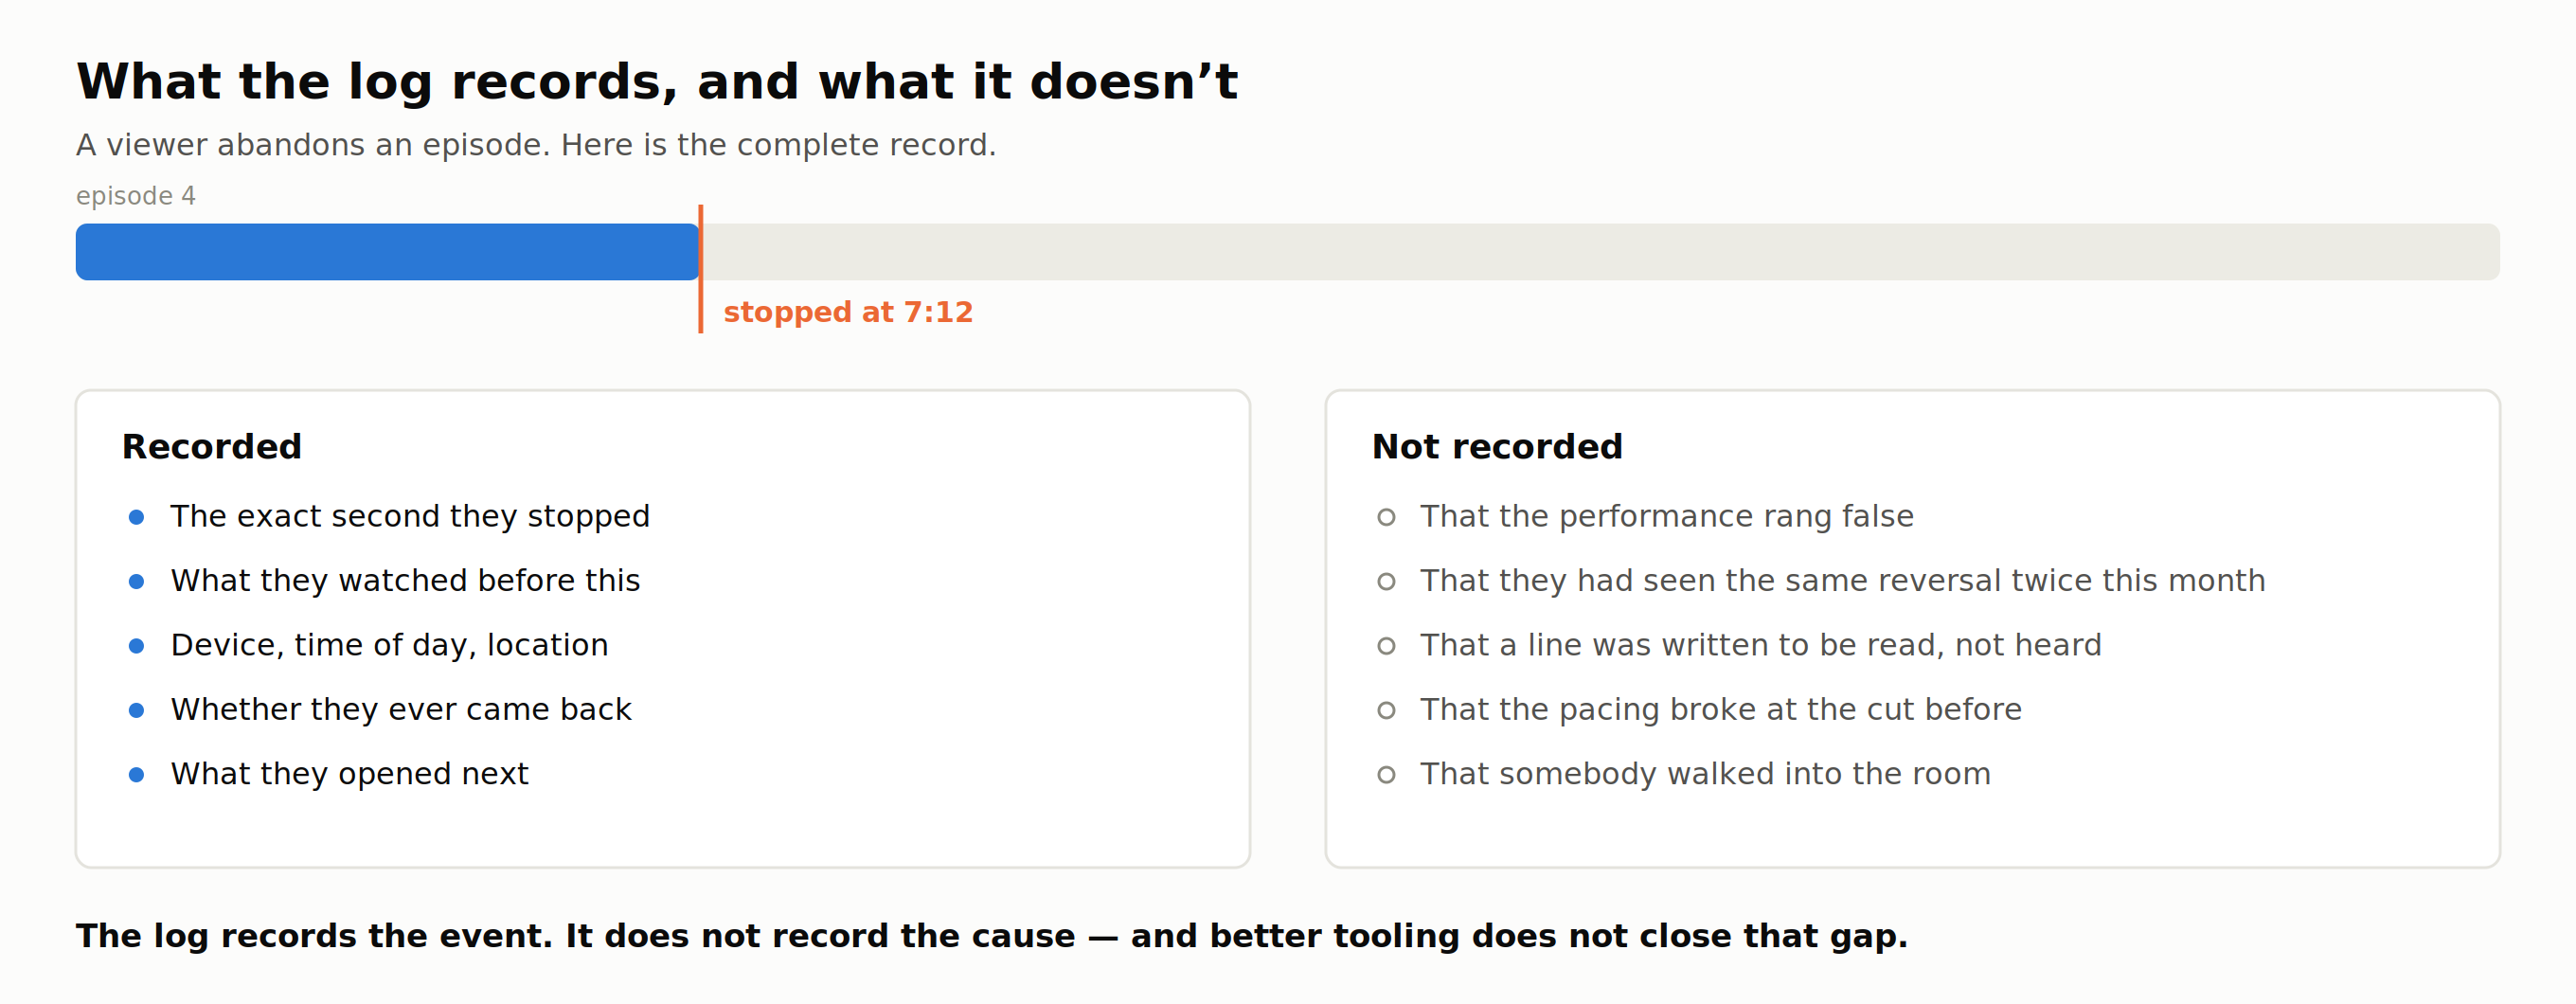 The complete record of an abandoned episode.
Here is what it does not know. It does not know that the performance in the scene before rang false. It does not know that the viewer had seen that exact reversal twice this month. It does not know that a line of dialogue was written for a reader rather than a listener. It does not know that somebody walked into the room.
The log records the event. It does not record the cause.
This is not a gap that better tooling closes, and that’s the important part. The reasons live inside a person, they are subjective, and most of them the viewer could not articulate if you asked. You can instrument the platform perfectly and this part stays outside the instrument.
What that looks like from inside
The clearest case I’ve watched happen was Kudi Yedamaithe, which we put out on aha in 2021.
I pushed for it hard, and I want to be accurate about why: not because I could show anyone evidence, but because I was convinced. A time-loop thriller in Telugu — no comparable, no precedent on the platform, nothing to point at. The people above me were not persuaded. They backed it anyway, on the reasoning that the person who had to make it believed in it, and with nothing on the table that was a defensible way to decide. I’ve never forgotten that they did.
What happened next wasn’t anybody’s mistake either. It went out with very little behind it, because marketing money goes where confidence is and confidence follows evidence — and there was no evidence. That is how every platform allocates, and it is entirely sensible right up to the moment you notice it is self-fulfilling: the titles you promote are the titles that perform, which confirms you promoted the right ones.
It found its audience anyway, on word of mouth, without the machinery that is supposed to create one. The marketing followed the result rather than producing it.
Nothing in any dataset explained that at the time. The only reason I can tell you about it is that I was in the building while it happened.
Which raises the only question that matters here: how big is the part you can’t capture? If it’s a rounding error, you can ignore it and get on with modelling. If it’s where the outcome actually lives, then a system built only on the captured part is measuring the shadow rather than the thing.
Two pieces of research answer this, and they’re worth understanding properly rather than name-dropping.
How big the unmeasured part is
The experiment that should be better known than it is
In 2006, three researchers at Columbia — Matthew Salganik, Peter Dodds and Duncan Watts — built a music website and ran 14,341 people through it across two experiments. They offered 48 songs by real but unknown bands. Participants could listen, rate, and download.
The clever part was the structure. In each experiment, participants were split into eight separate, parallel worlds, plus an independent control group where nobody could see anyone else’s choices. Inside each world, people could see how many times each song had been downloaded by others in that same world. The worlds could not see each other. Everyone started from zero.
Same songs. Same starting conditions. Eight independent runs of the same market.
Think of it as your platform’s Top 10 rail. This experiment ran that rail eight separate times, from scratch, with identical inputs — and then compared the eight.
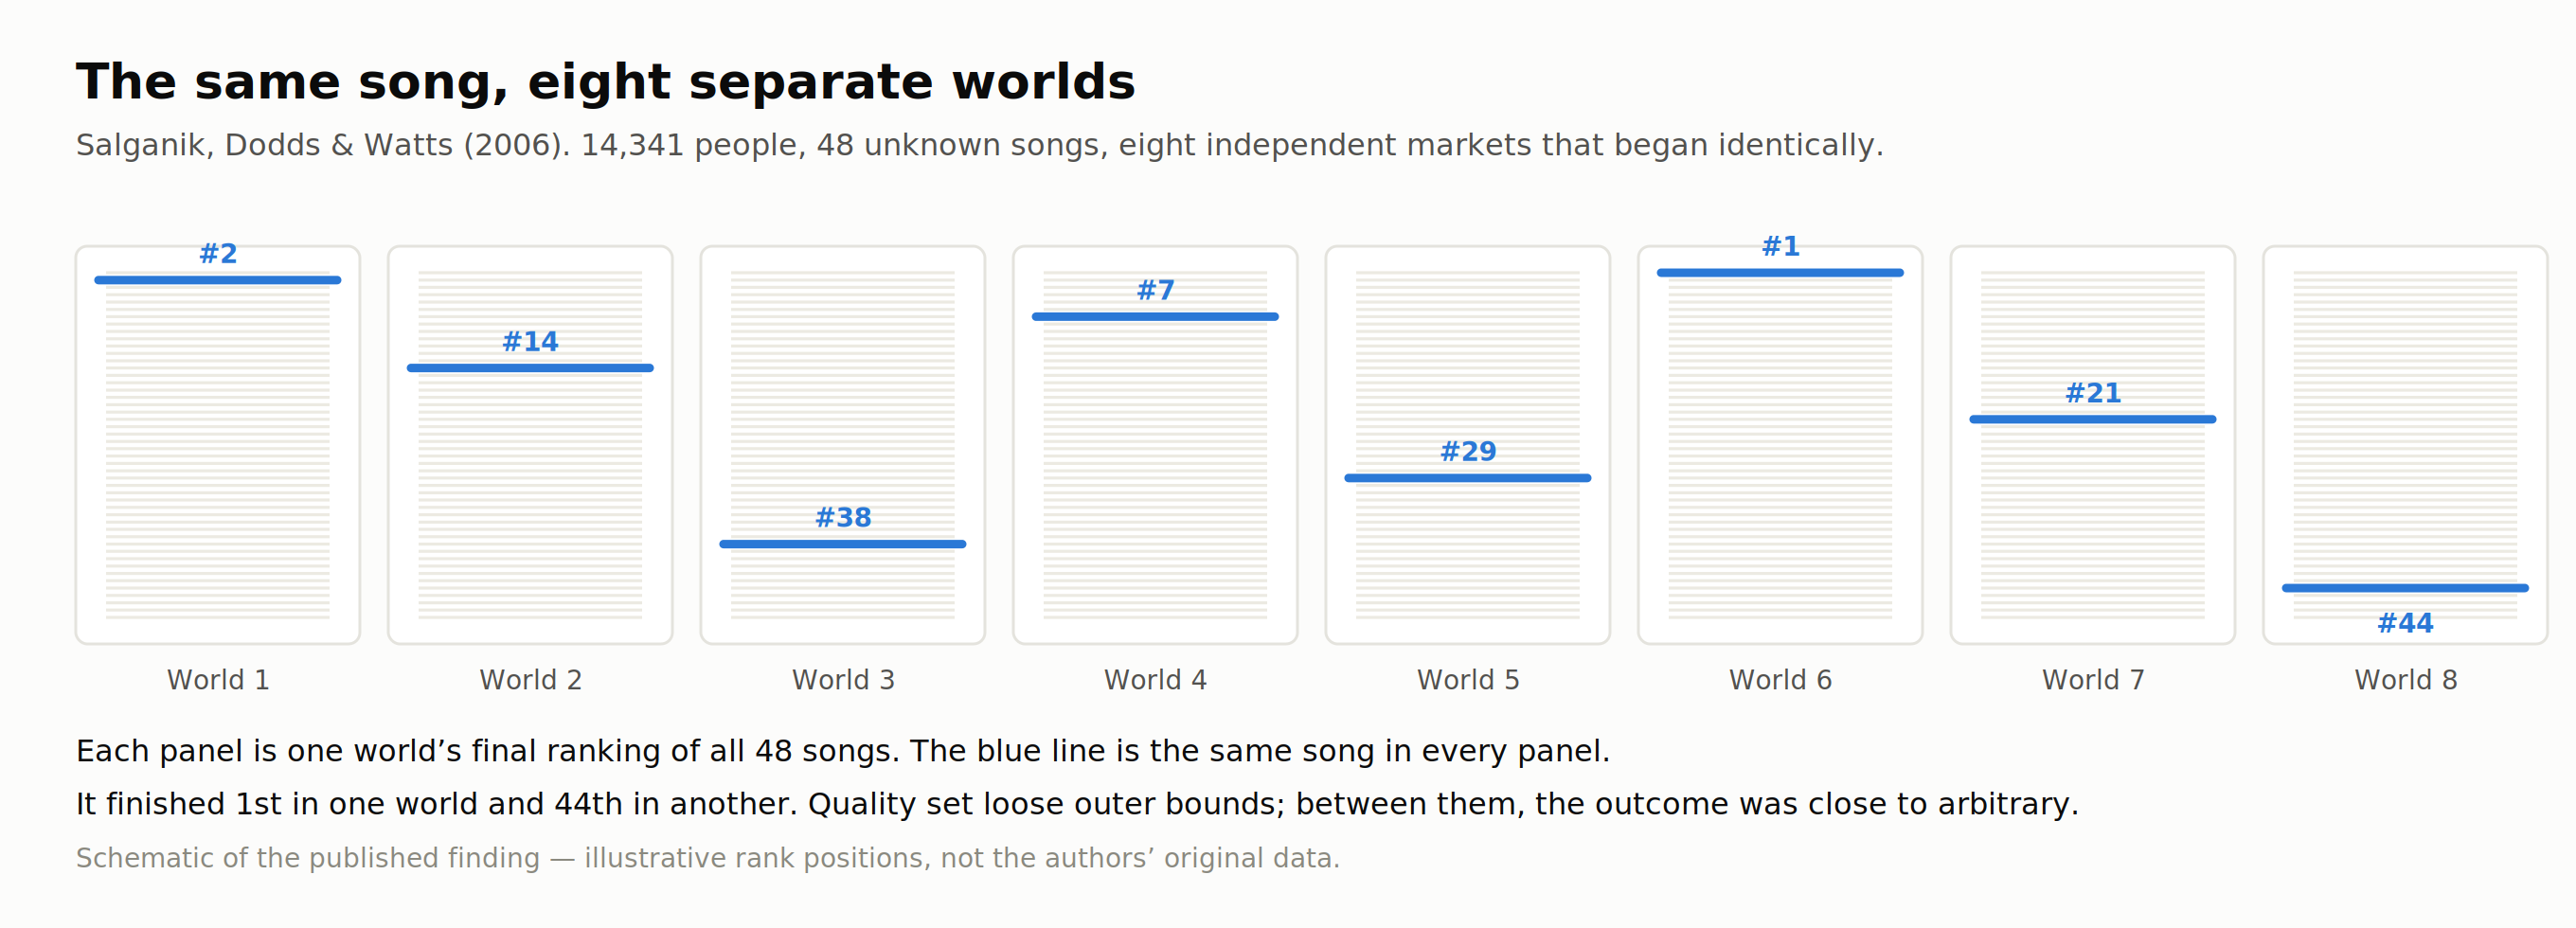 Salganik, Dodds & Watts (2006) — schematic of the finding.
The results: the same song was a hit in one world and nowhere in another. Song rankings diverged wildly across worlds that began identically.
Quality still mattered, but only at the edges. A genuinely excellent song never finished dead last, and a genuinely terrible one never finished first. So quality decided the range a song could land in — not where inside that range it actually landed. A very good song might come first in one world and twenty-fifth in another, and both were normal.
Almost every song sits in that middle band. Inside it, the result was close to a coin toss.
Then the finding that should concern anyone running a recommendation surface. Showing people what was popular made the outcome less predictable, not more.
Here is the mechanism, step by step. In the control group, where nobody could see any download counts, people judged the song. In the eight worlds where counts were visible, the first handful of downloads — essentially whoever happened to click first — told everyone arriving next what to listen to. Three lucky early downloads put a song near the top of the list. Being near the top got it more plays. More plays got it more downloads. The lead compounds, and by the end it is enormous.
So the popularity number is not reporting quality back to you. It is manufacturing the result. And the more prominently you display it, the more the final outcome depends on an accident in the first hour that nobody chose and nobody can reproduce.
Your trending rail is not a thermometer. It is a heater. (Science · full paper, PDF)
Two years later they went further, and this is the part worth sitting with.
They ran the whole thing again with 12,207 people. But this time they lied. They took the real download counts and turned them upside down — the least popular song was displayed as the most popular, the most popular was shown at the bottom, and everything in between was flipped. Then they let the market run and watched what it did with a signal they knew to be false.
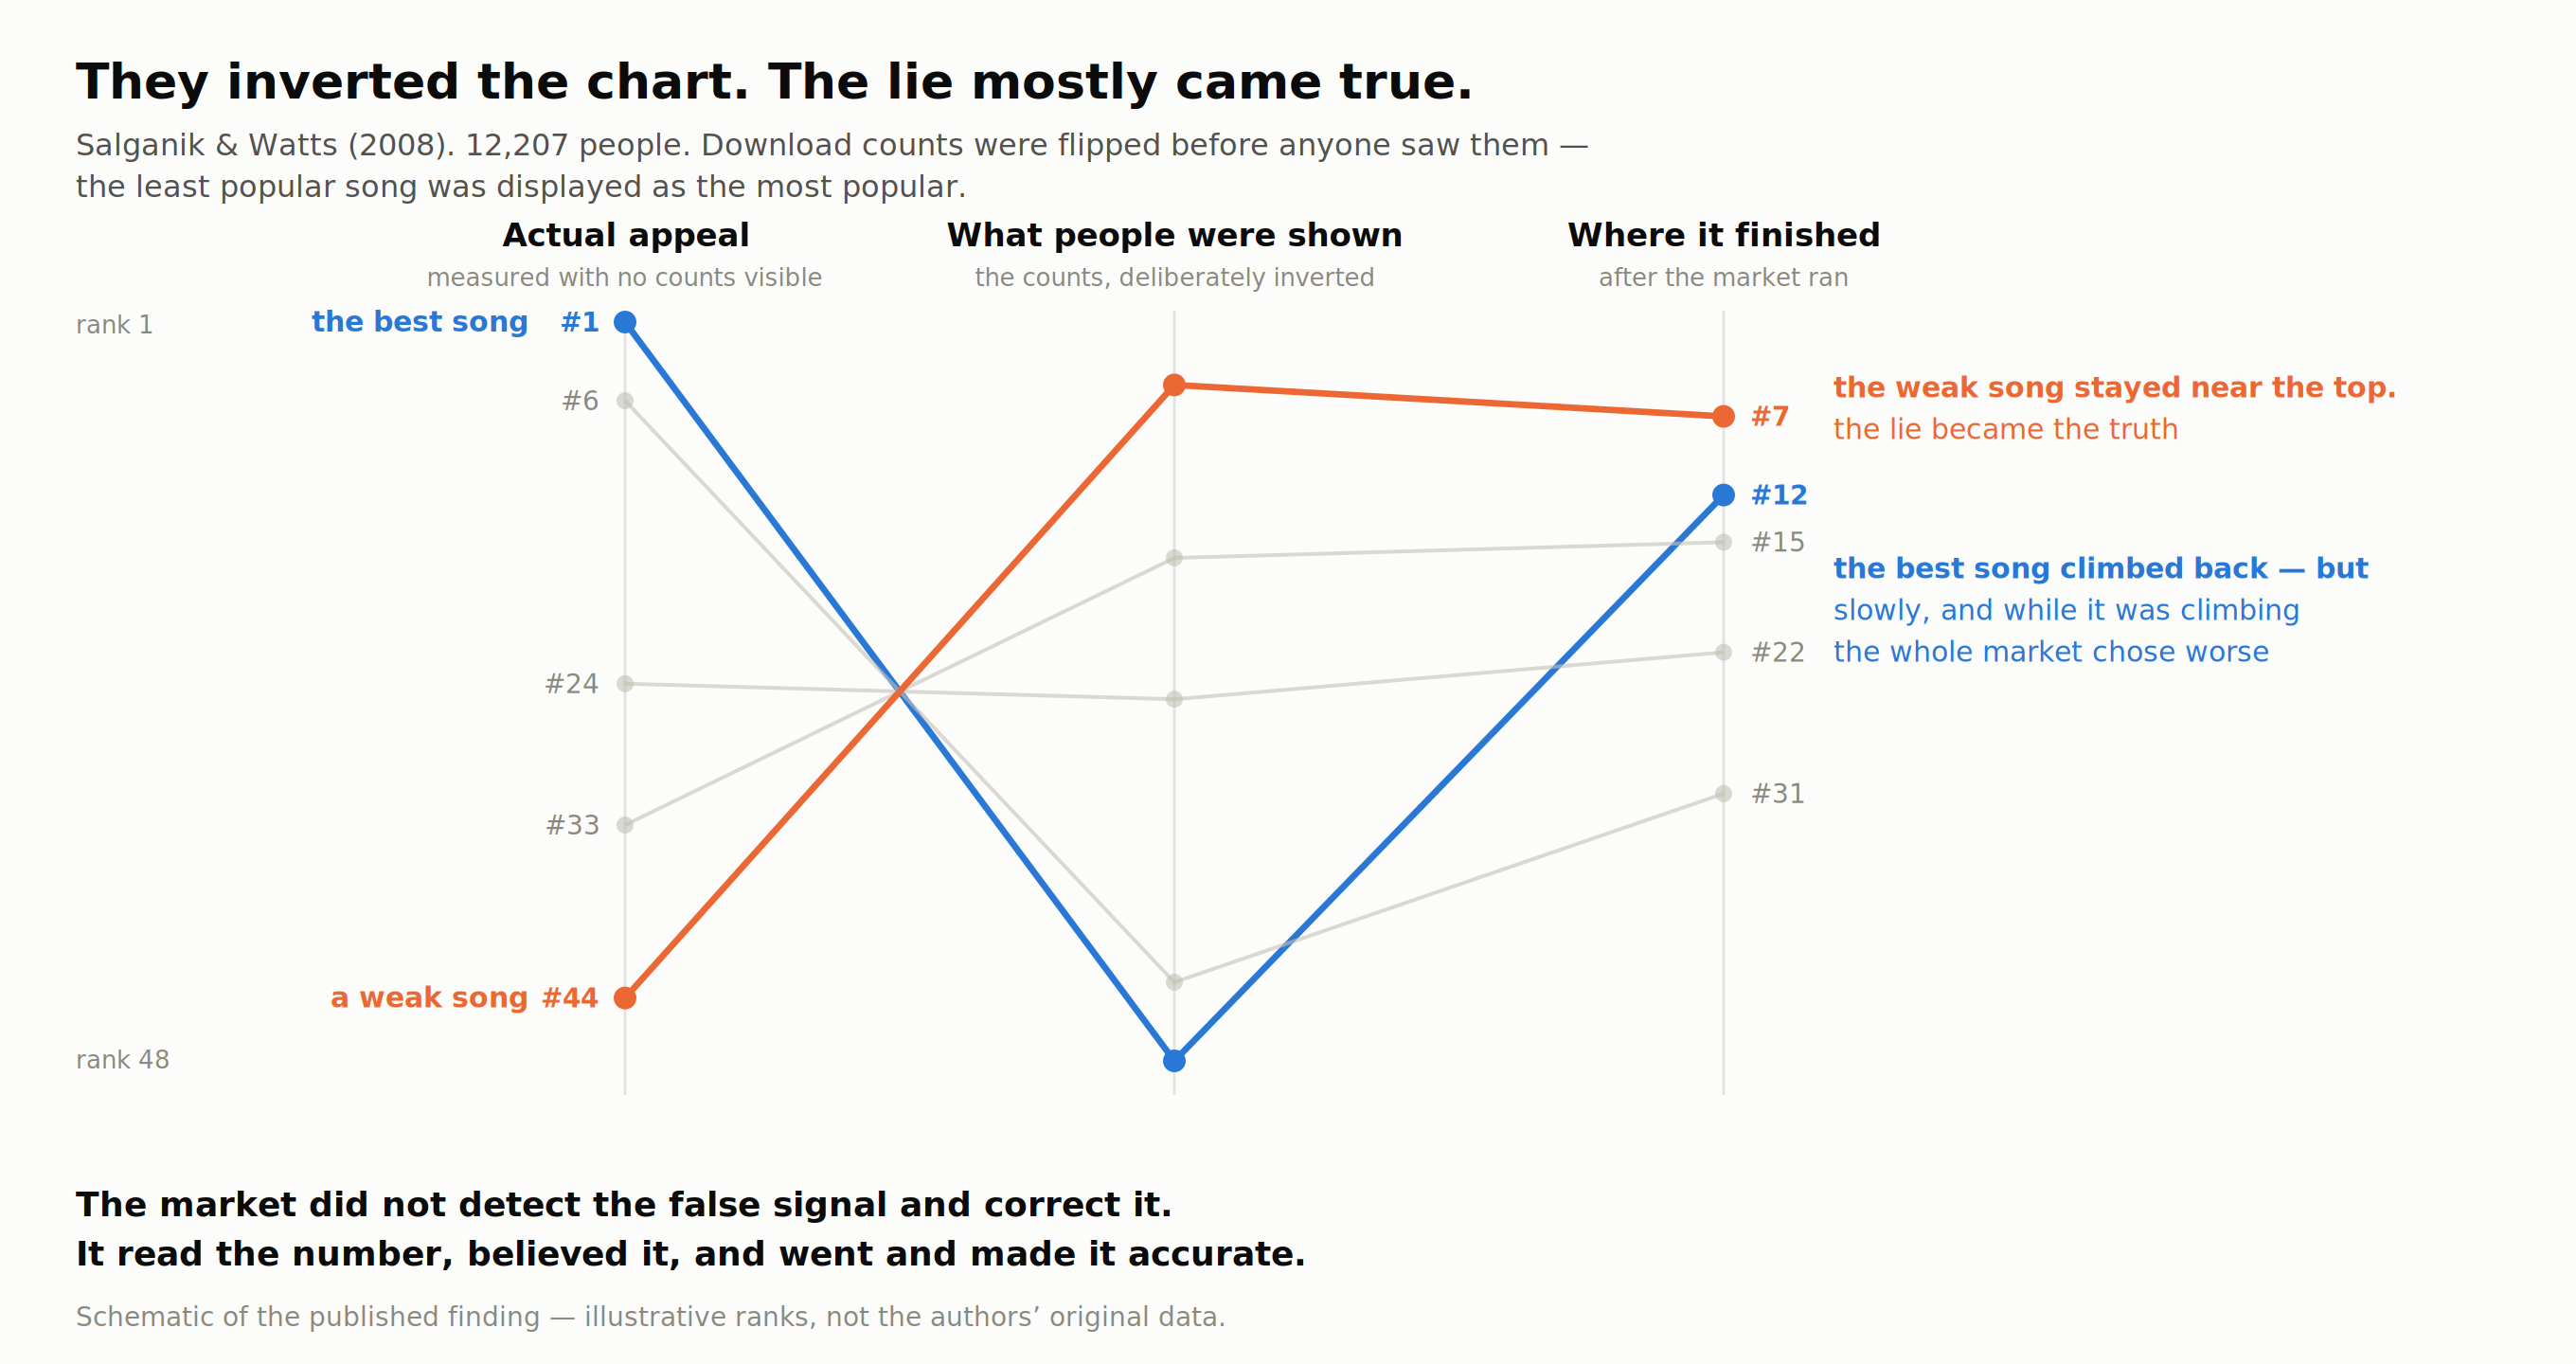 The inversion study — schematic of the finding
The lie mostly came true.
Songs shown as popular became popular. The market did not detect the falsehood and correct it. It read the number, believed it, and went and made it accurate.
There was one exception, and it matters. The genuinely best songs did claw their way back up eventually. So quality is real and it does assert itself in the end. But it took a long time — and for that entire stretch, the market was making worse decisions than it would have made with no popularity signal at all. (Social Psychology Quarterly)
The lesson for anyone commissioning against a dashboard is uncomfortable. Feed a system a wrong number and it will not reject it. It will spend a long and expensive time proving you right.
What this means for a commissioning table. Success is not purely a property of the thing you made. It is partly a property of what happened to it in its first hours. Which means that when you train a model on historical performance, a meaningful share of what you are learning is not audience preference — it is the residue of early accidents that got amplified.
And the numbers don’t behave the way spreadsheets assume
The first study explains why outcomes are unpredictable. The second is about how unevenly they land once they arrive — and why that breaks the arithmetic almost everyone uses on them.
Arthur De Vany and David Walls studied film revenues — 2,015 films in one of their datasets — and found the distribution is not the familiar bell curve. It has what statisticians call a very heavy tail.
Here is what that means without the maths. In a normal distribution, the average is meaningful and stable: measure a thousand people’s heights, add a thousand more, the average barely moves. In a heavy-tailed distribution, it doesn’t work like that. One more film can move the average of the whole sample. The average is unstable because the extreme outcomes are so large that they dominate everything else.
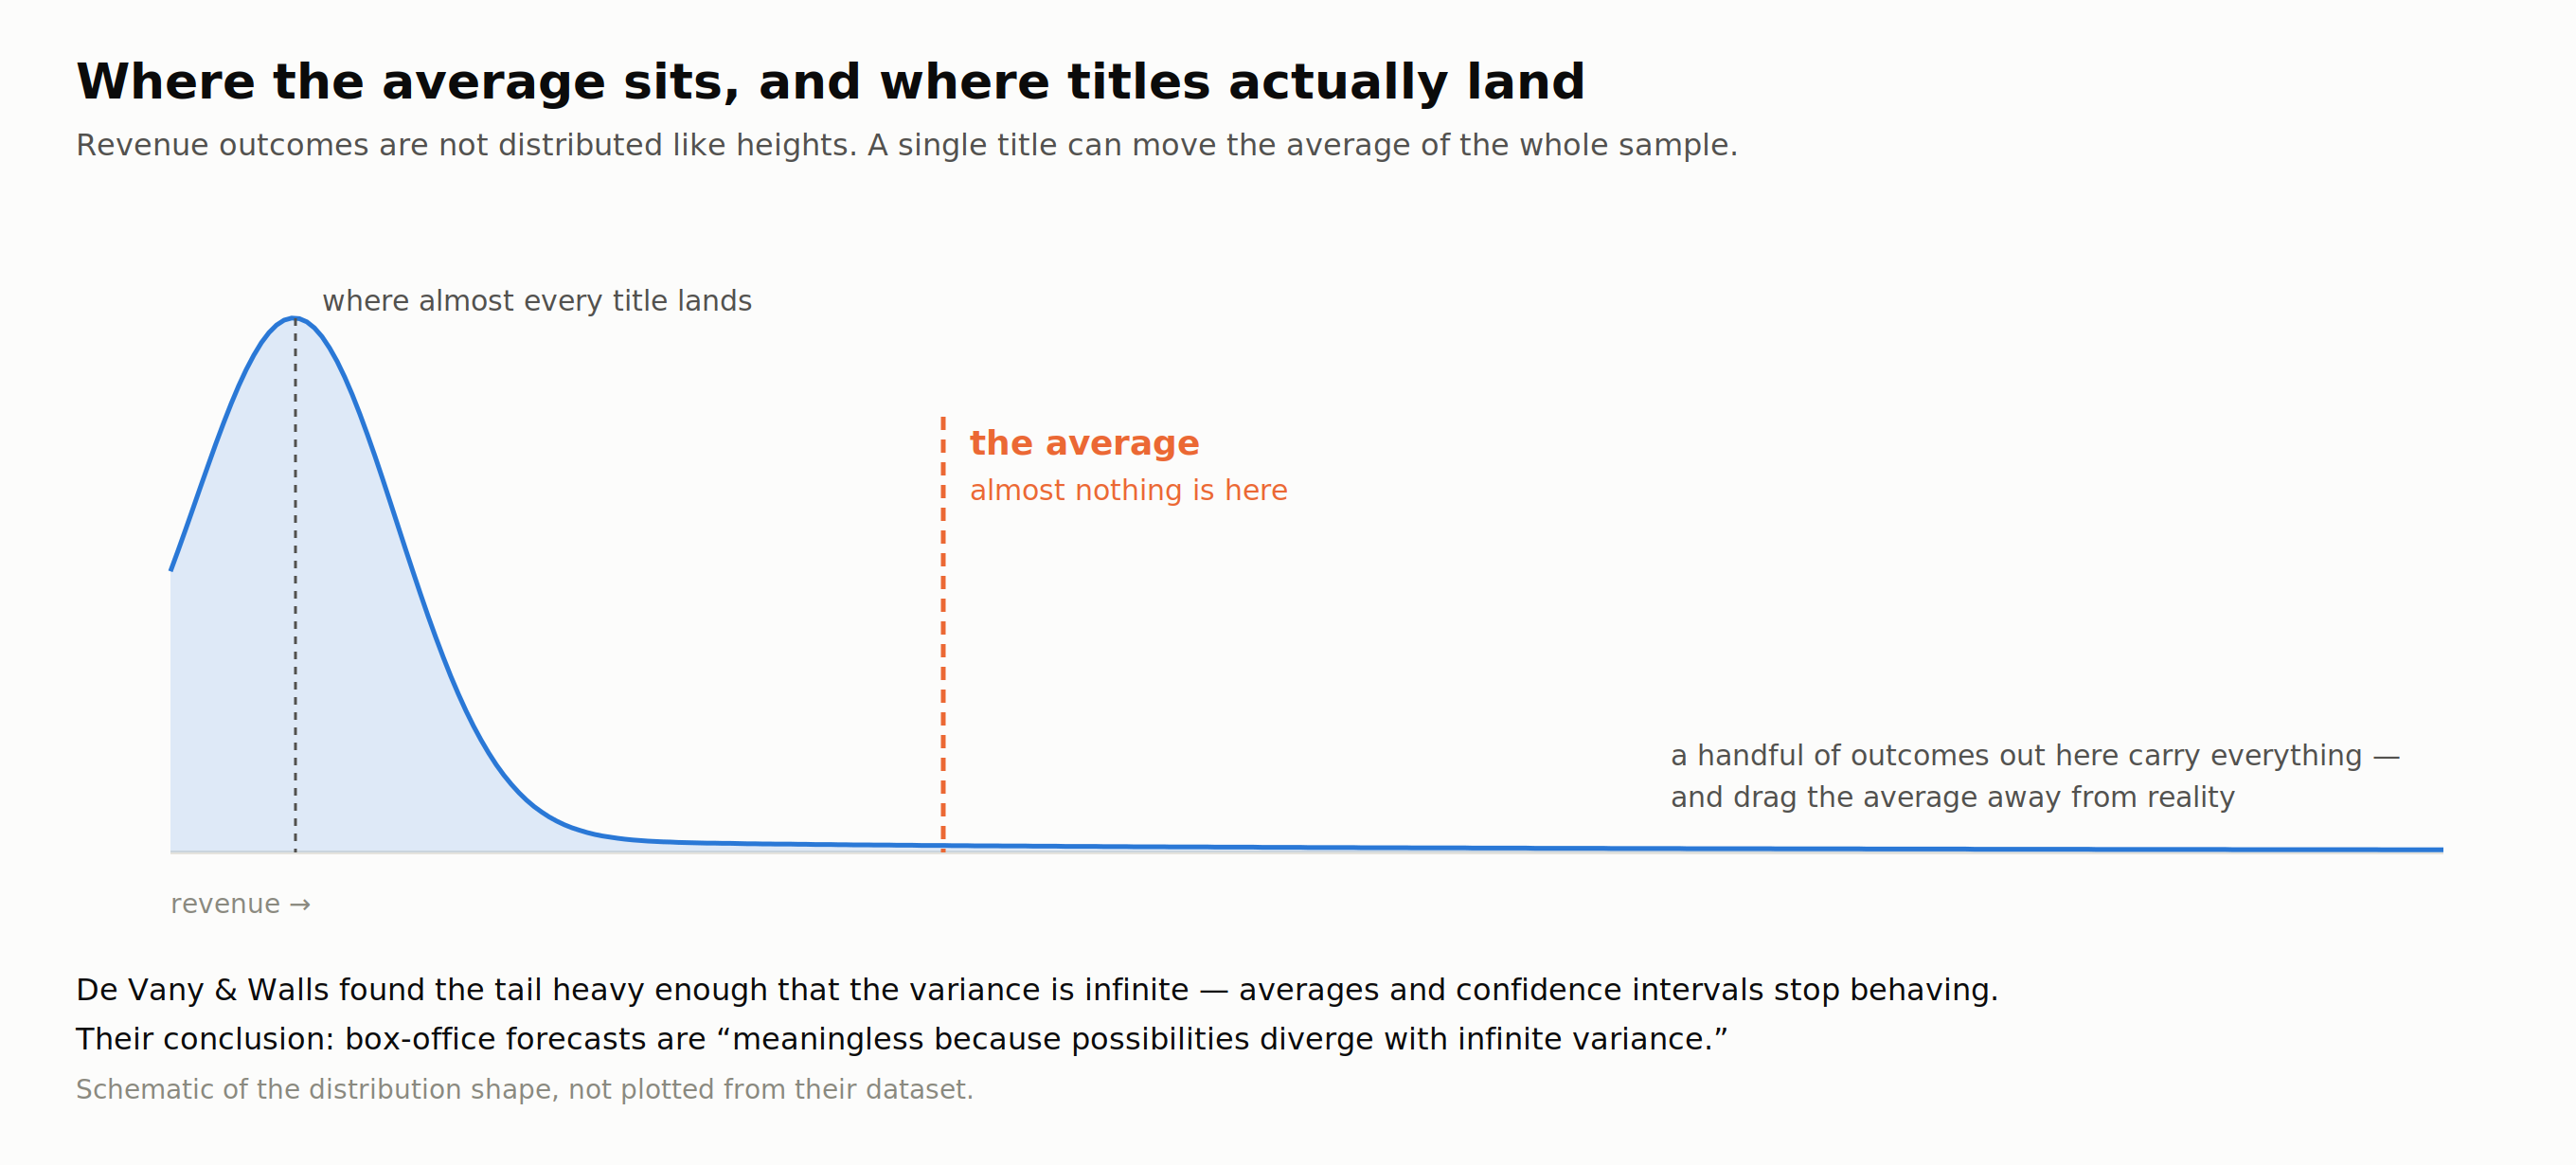 Why the average stops meaning anything.
Their finding, on their estimates, is that the tail is heavy enough that the variance is infinite — which sounds abstract but has a concrete consequence: the standard statistical tools stop working. Averages, confidence intervals, “expected return” — these all assume a stable centre that doesn’t exist here.
Their own conclusion was blunt: “Forecasts of expected revenues are meaningless because the possibilities do not converge on a mean; they diverge over the entire outcome space with an infinite variance.” And on the reliability of stars: “No star is ‘bankable’ if bankers want sure things.” (Journal of Cultural Economics · JEDC)
So the problem is not that forecasting content outcomes is difficult. It’s that for this class of outcome, the thing being forecast doesn’t have a well-defined value to forecast.
A third problem nobody mentions
There’s one more, and it’s the quietest.
You only ever see the results of things that got made.
Every dataset of “what worked” is a dataset of what somebody approved. The projects that were passed over have no outcomes attached — they don’t appear at all. So a model trained on that history is learning the taste of previous commissioners at least as much as the behaviour of audiences.
This has a formal name — the selective labels problem — and the most rigorous treatment comes from outside media, in work on judicial bail decisions. The finding transfers exactly: when a human decision-maker uses information the dataset doesn’t contain to decide which cases proceed, any evaluation built on the resulting data is biased. Including a backtest of your model against past decisions. (Lakkaraju, Kleinberg, Leskovec, Ludwig & Mullainathan, KDD 2017, PDF)
Put the three together and the picture is consistent. Historical performance data is a record of outcomes that were partly accidental, distributed in a way that defeats averaging, and filtered through the preferences of whoever was approving things at the time.
That is not a reason to ignore it. It is a reason to be precise about what you ask it.
So: what happens when a system is built to answer the one question this data can’t answer?
The live case: vertical micro-drama
There is a category testing this right now, at speed, with real money, and it deserves describing accurately rather than judging.
Vertical micro-drama — one-to-three-minute episodes, seventy to a hundred and fifty per title, shot vertically for a phone — arrived in India in force through 2025 and reached the South Indian languages in the first half of 2026. The volumes are unlike anything long-form attempted. KukuTV describes releasing 200 to 250 shows a month. (Hollywood Reporter India) Story TV has committed to more than 1,000 South Indian originals by March 2027. (afaqs)
The economics are what permit this. A micro-drama episode is reported at roughly ₹20,000–50,000, against ₹25 lakh to over ₹1 crore per episode for a long-form Indian original — somewhere between fifty and five hundred times cheaper — with production cycles measured in days. (exchange4media)
And here is the genuinely interesting part, which tends to get lost in the noise about the category: micro-drama produces far better data than long-form ever has.
The structure does it. Episodes are short, so drop-off is located precisely rather than approximately. The first ten to twenty episodes are typically free and the rest sit behind a payment, so every title contains a moment where a viewer either pays or doesn’t — an explicit, recorded, per-viewer decision. You learn which episode lost people. You learn which cliffhanger converted.
A long-form original has no equivalent instrument. There is no price point per beat. You get one aggregate outcome, months later.
So more bets, at lower cost, each returning a denser signal. On the face of it, this is the strongest environment for data-driven commissioning that anyone in this business has ever had.
Which is why what platforms are now building on top of it is worth watching closely. The chief operating officer of one platform describes a system that “scans past trends and makes a prediction on what the slate should broadly be for the month to come — how many thrillers, fantasies, billionaire tropes, revenge arcs.” The founder of one of the largest global players describes a comparable simplification of story itself: “we realized we needed to simplify the stories… People aren’t ready to consume complex stories on their cellphones.” (Hollywood Reporter India · Deadline)
Two observations, and I’ll leave them next to each other.
The signal these systems learn from is behavioural and episode-level: where attention broke, where money changed hands.
The output they are increasingly asked to shape is story and dialogue.
The two numbers that can move apart
If you wanted to know — empirically, from the outside or the inside — how a slate built this way is actually performing, there is a specific thing to watch, and it isn’t the one most operations report.
Completion measures whether people finish what they start.
Retention measures whether they are still there next month.
They are usually correlated, which is why they get treated as one idea. They can come apart.
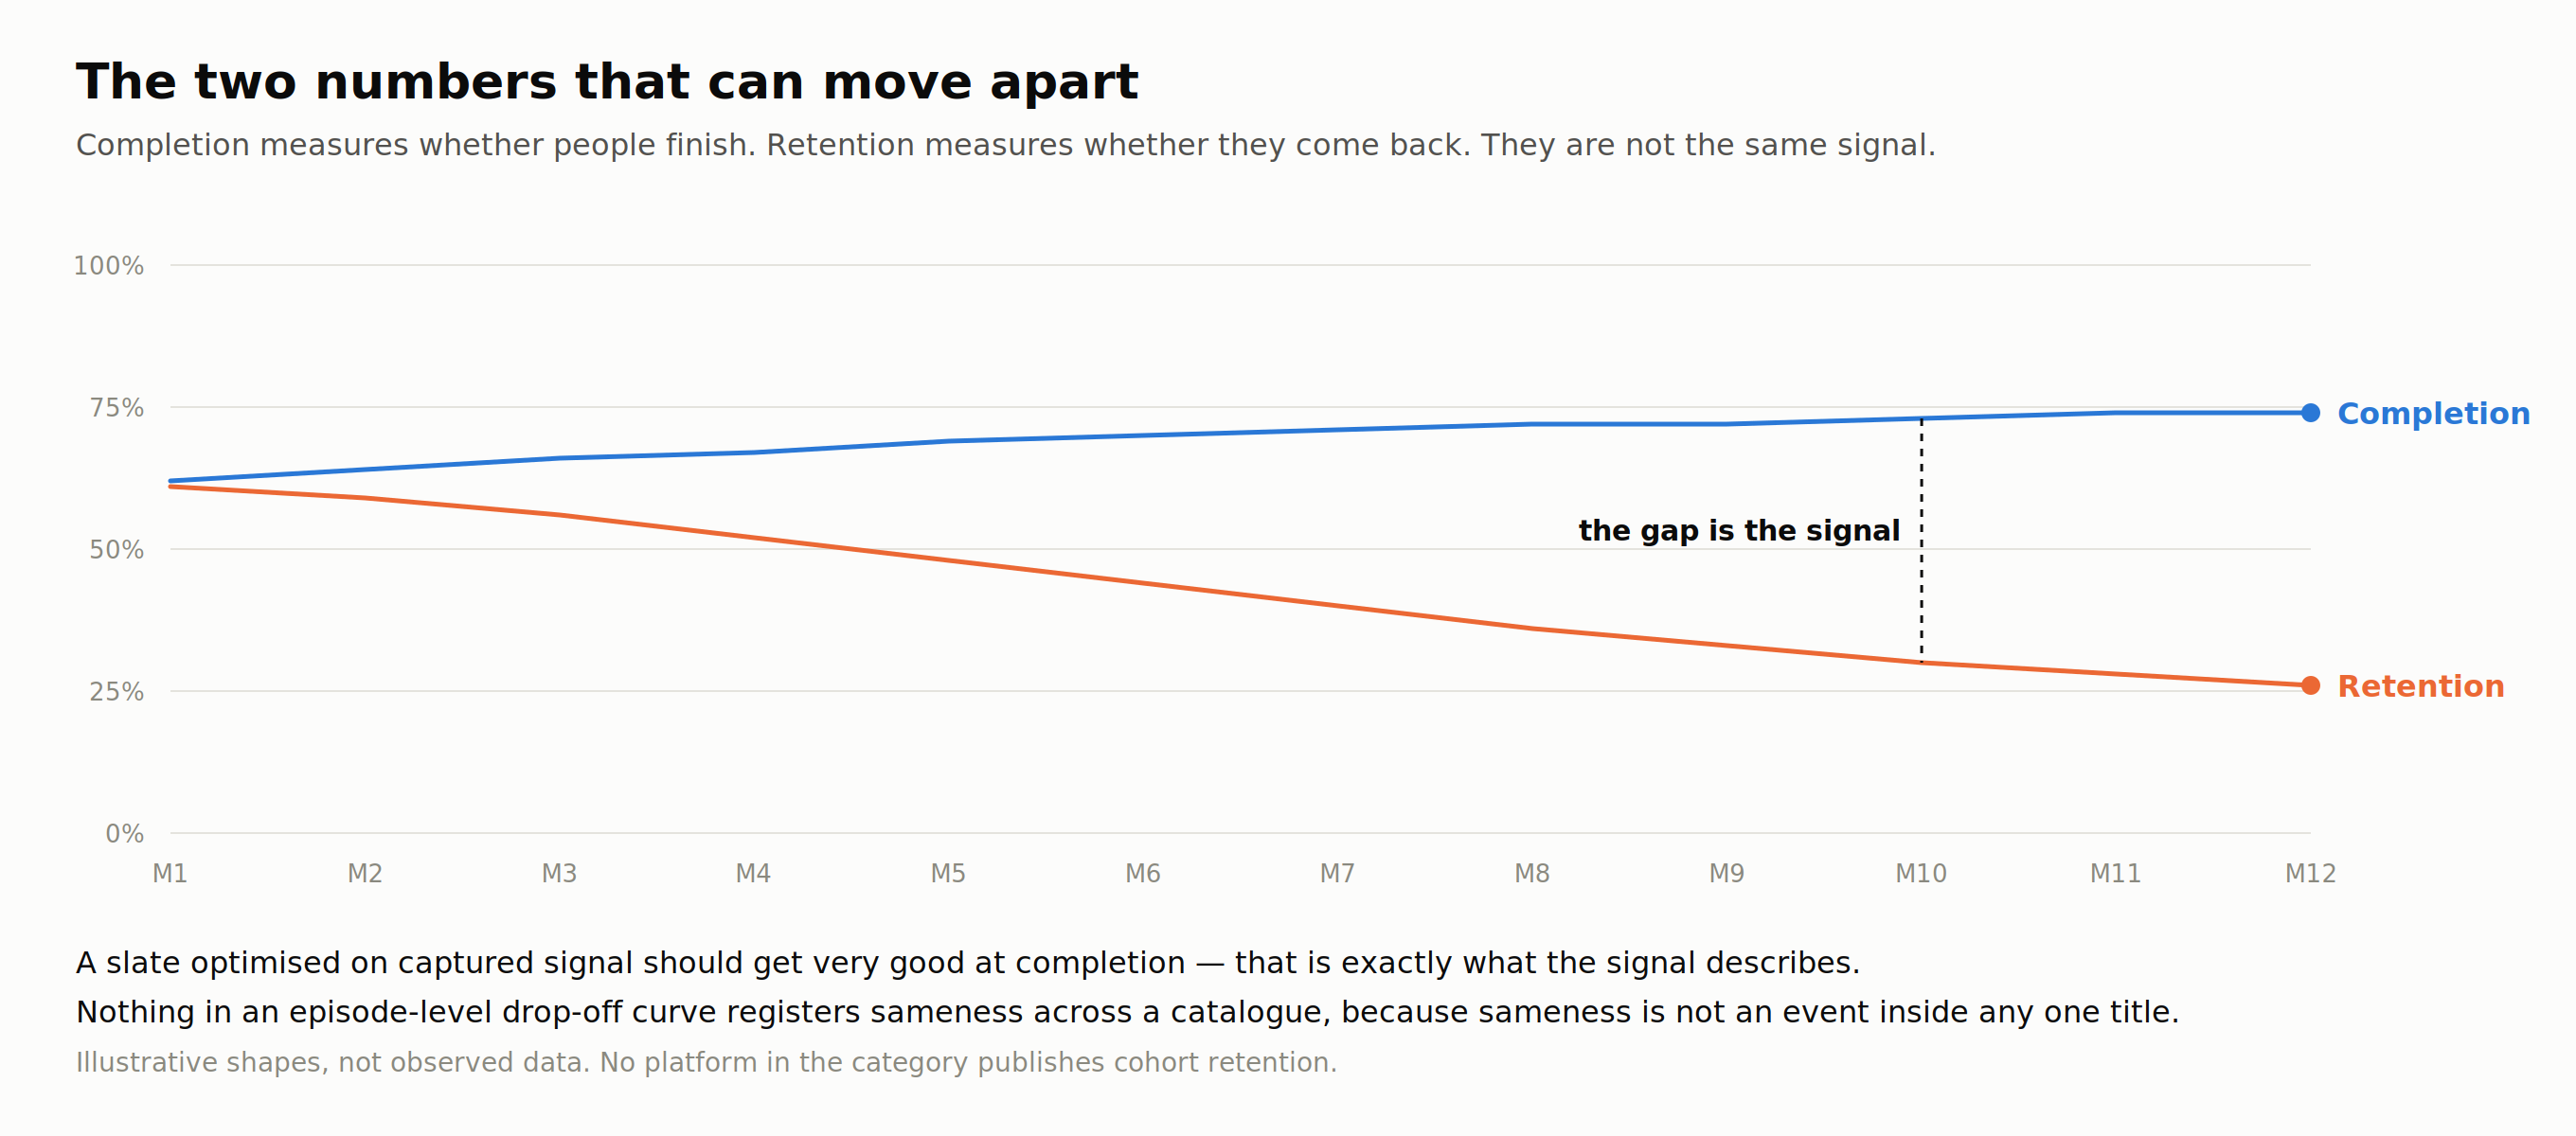 Completion and retention, and the gap between them.
A slate optimised against captured signal should become very good at completion. That is precisely what the signal describes: what holds attention inside a title, where the break points are, which beat converts.
What that signal contains nothing about is what happens to a person’s relationship with the service after the twelfth title that resolves the same way. Nothing in an episode-level drop-off curve can register sameness across a catalogue, because sameness is not an event inside any single title.
So the diagnostic is the gap between the two lines — completion flat or rising while cohort retention slopes down. Not either number alone.
This is an observation about measurement, not a prediction about outcomes. It says: these two things can diverge, the divergence is informative, and most operations are not arranged to see it — because completion sits in a content report and churn sits in a growth report, they are read by different people, and often on different clocks.
In India this is currently unanswerable from outside. No platform in the category discloses churn, per-title conversion, or long-run cohort retention.
Which brings us to what you do when the instrument doesn’t exist yet.
Guidelines: commissioning when you don’t have the data
If you are launching in a language, a format or a market nobody has measured, the honest position is that you have no performance history to consult. That sounds like a disqualifying weakness. It isn’t. It is a named problem with a literature attached.
It has a name: cold start
The software that recommends things to you has exactly this problem every time something new arrives. A brand-new item has no history, so the system has no way to place it — not places it badly; it has no basis to place it at all.
The formal statement is that these systems learn from a table of past behaviour, and a new item has no row in that table. Its position isn’t badly estimated; it’s undefined. The fix cannot come from the behaviour data, because there isn’t any — it has to come from outside it. (Schein, Popescul, Ungar & Pennock, 2002 · Koren, Bell & Volinsky, 2009)
That literature’s answers translate straight into commissioning practice.
1. When you can’t ask how it performed, ask what it’s made of. With no history, the only usable information is the properties of the thing itself — observable before release. In practice this means defining the structural features of a title you can actually record and check: where the first turn lands, how many characters carry the story, whether the central want is stated or implied. Not genre labels, which are too coarse to learn from. Features specific enough that two people watching the same title would write down the same value.
2. Borrow from a market you already know — and be strict about what actually crosses over. You have real data from a market you run, and none in the one you are entering. Some of what you know will carry across. Some of it will confidently mislead you, and the whole discipline is telling those two apart. The recommender-systems literature calls this cross-domain transfer and treats it as a technical problem; in commissioning it is a judgement one. (Fernández-Tobías, Cantador, Kaminskas & Ricci, PDF)
The rule of thumb I would use: what people want from a story usually travels. What they will pay for it almost never does. A revenge drama that works in Hindi will very likely work in Telugu — the appetite crosses over. But the price a Hindi viewer will pay, the point in the story where they will pay it, how many free episodes they need first, and how they behave once they have paid — none of that crosses over reliably.
Regional expansions rarely fail on the first kind. They fail on the second, and they fail expensively, because the assumption is never written down anywhere it could be challenged.
3. Spend part of the slate on learning, and decide which part in advance. There is a formal version of this, and its name explains it. It is called a bandit algorithm, after slot machines — one-armed bandits. You keep pulling the arm that is paying out, because that is where the money is. But you deliberately pull the other arms every so often, because otherwise you will never discover that one of them pays better.
The published example: Yahoo’s front page had to choose which news story to show each visitor. A system that deliberately spent a slice of its traffic testing stories it was uncertain about — rather than always serving the current best performer — got around 12.5% more clicks than one that didn’t. It bought that improvement with traffic it knowingly gave up. (Li, Chu, Langford & Schapire, WWW 2010)
In commissioning terms: of every ten titles, decide before you make them that two exist to answer a question you have written down. Not “we’ll learn from everything” — everybody says that and nobody does it, because a question you didn’t write down in advance is a question you will answer with whatever the result turns out to be.
In commissioning terms: some share of what you make exists to answer a question you have written down, and you decide which titles those are before you make them. Every slate does this accidentally. Almost none does it deliberately, and the difference is whether you can say afterwards what you learned.
4. Buy the option before you buy the thing. Where a format allows staged commitment — a short order, a pilot, a first block of episodes — the value isn’t the smaller cheque. It’s that you have arranged to receive information at a point where you can still act on it.
And when you’re running on judgement, run on disciplined judgement
With thin data you are making judgement calls whether you admit it or not. The research on what separates good judgement from bad is unusually clear, and almost none of it is about being smart.
5. Start from how things like this usually go, not from this one. When a project is in front of you, you naturally think about this project — its script, its director, its particular promise. Kahneman and Lovallo called that the inside view, and its reliable effect is to make everybody in the room optimistic. Every project looks like the exception when you are looking straight at it.
The outside view starts somewhere else entirely. Ignore this project for a moment and ask: how have titles of this type generally turned out? (Kahneman & Lovallo, Management Science, 1993)
In practice: before deciding whether your revenge drama will work, find out what share of the revenge dramas you have released in the last two years actually did. If the answer is one in six, then one in six is where you start, and the specifics of this one move it up or down from there. Most commissioning tables have never established the one in six — which means every project is assessed as though it had no ancestors.
This is the base rate from the opening, arriving at the moment it becomes useful. It is the one number you can establish without any market data at all, using only your own history, and it is the cheapest correction available to anyone deciding in the dark.
The evidence that this works is not from media. In a large forecasting tournament funded by US intelligence agencies, thousands of volunteers forecast real world events over several years. Those trained in these habits — reference classes among them — measurably out-forecast those who weren’t. (Mellers et al., Psychological Science, 2014)
For a commissioner this is concrete: before deciding whether a title will work, know what proportion of titles like it did.
6. Decompose the question into things that can be checked. “Will this work” cannot be evaluated. It breaks into questions that can: is there an audience of this size, can it be made for this money, does this team deliver on schedule, does the first turn land where it should. Each of those is answerable, and several are answerable cheaply, before you commit.
7. Write down the number that would stop you — before you decide. This is the test I’d apply to any operation claiming to be data-driven: name the number that would have stopped the last thing you approved. If nobody in the room can, the dashboards are decoration. A metric that cannot overturn a decision is not informing it.
8. Score independently before you discuss. From Kahneman, Sibony and Sunstein’s work on organisational noise (Noise: A Flaw in Human Judgment, 2021): the variation between different people judging the same case is often larger than any systematic bias, and it collapses the moment the most senior person in the room speaks first. The remedies are unglamorous and they work — independent written scores before discussion, the decision broken into components assessed separately, and comparisons against other candidates rather than absolute ratings.
9. Keep the record of what you expected. Almost nobody does this, and it is the cheapest thing on the list. Write down, at greenlight, what you expect to happen and why. Then read it back when the result arrives. Without it you cannot tell a good decision that got an unlucky outcome from a bad decision that got away with it — and given everything in the section above about how noisy these outcomes are, that distinction is the only route to actually improving.
Why this is harder in India, and hardest in the regional languages
Everything above assumes you can at least see the market. In Indian streaming, largely, you can’t.
BARC India measures television, not streaming. It runs roughly 63,000 metered homes against a television universe of more than 200 million households. The 2026 ratings framework requires technology-neutral measurement covering OTT and connected TV — but that is a requirement placed on it, not a product that exists today. (BestMediaInfo)
The syndicated streaming trackers are panel estimates, not census data. Ormax launched StreamView in January 2026 — a weekly top 50 built from online surveys and an in-house panel, 2,500-plus respondents a week at launch and scaling, where a “view” means watching a property for at least 30 minutes in a week. It covers all languages, and it explicitly excludes short-form video, including micro-drama. (Ormax) COTT publishes weekly title-level unique viewers including Telugu, Tamil, Kannada and Malayalam titles, with its headline figure derived from a modelled multiplier. (MediaBrief)
These are useful. They are not what a commissioner needs.
Here is the fact that matters most, and it is a fact about absence. Nobody publishes title-level completion or episode drop-off for a single Telugu title. Not one. The platforms hold that data; none of them release it. The same is true in Tamil, Kannada, Malayalam and Bengali.
So in India, and especially in the regional languages, “data-driven commissioning” cannot mean consulting the market’s data. There is no market data at the level a decision needs. It can only mean first-party — your own instrument, on your own platform, built by you.
And that produces the situation this whole piece has been circling:
You are building the instrument and the slate at the same time. The instrument doesn’t produce usable signal until it has run for a while, which means it cannot inform the decisions that come first. Your earliest commissions — the ones that establish the slate, hire the team, and set what the platform is — are made in the dark by construction.
The response to that is not to wait, and not to pretend. It is to decide, before commissioning anything, what you are going to measure and what result would change your mind. That is the one part of the system you can get completely right on day one, when you have no data at all. And it’s the part most operations never write down, which is why so many of them arrive at year three with three years of numbers and no idea which of their decisions were good.
This is one post, and the subject is much larger
I’ve deliberately stopped short in several places.
I haven’t gone into what a first-party measurement stack should actually contain, or the order to build it in. I haven’t covered how to define title attributes precisely enough to learn from — which is where most attempts quietly fail. I haven’t touched the specific question of how completion behaves in short-form versus long-form, where the differences are larger than people assume. And I haven’t said anything about what any of this means for writers and writers’ rooms, which is where I think the most interesting problems are.
Those are the next posts. If this was useful, follow along — I’ll be going considerably deeper on each of them.
Karthik Vamsi Tadepalli built the content function at aha and has spent the last year researching the vertical micro-drama market in Telugu.