Data-driven commissioning · Part 3
What Your Commissioning Spreadsheet Cannot Tell You
What the columns of your commissioning spreadsheet actually record, which of them are facts and which are opinions in a fact's clothes, and why even the real ones cannot tell you what will happen. Part three of a series on commissioning.
Open the spreadsheet your team uses to decide what to make next.
You know the one. A row for every title you have made. Columns across the top: genre, language, episode count, runtime, lead cast, completion, retention. It is the closest thing this business has to institutional memory, and every slate argument is really an argument about what it says.
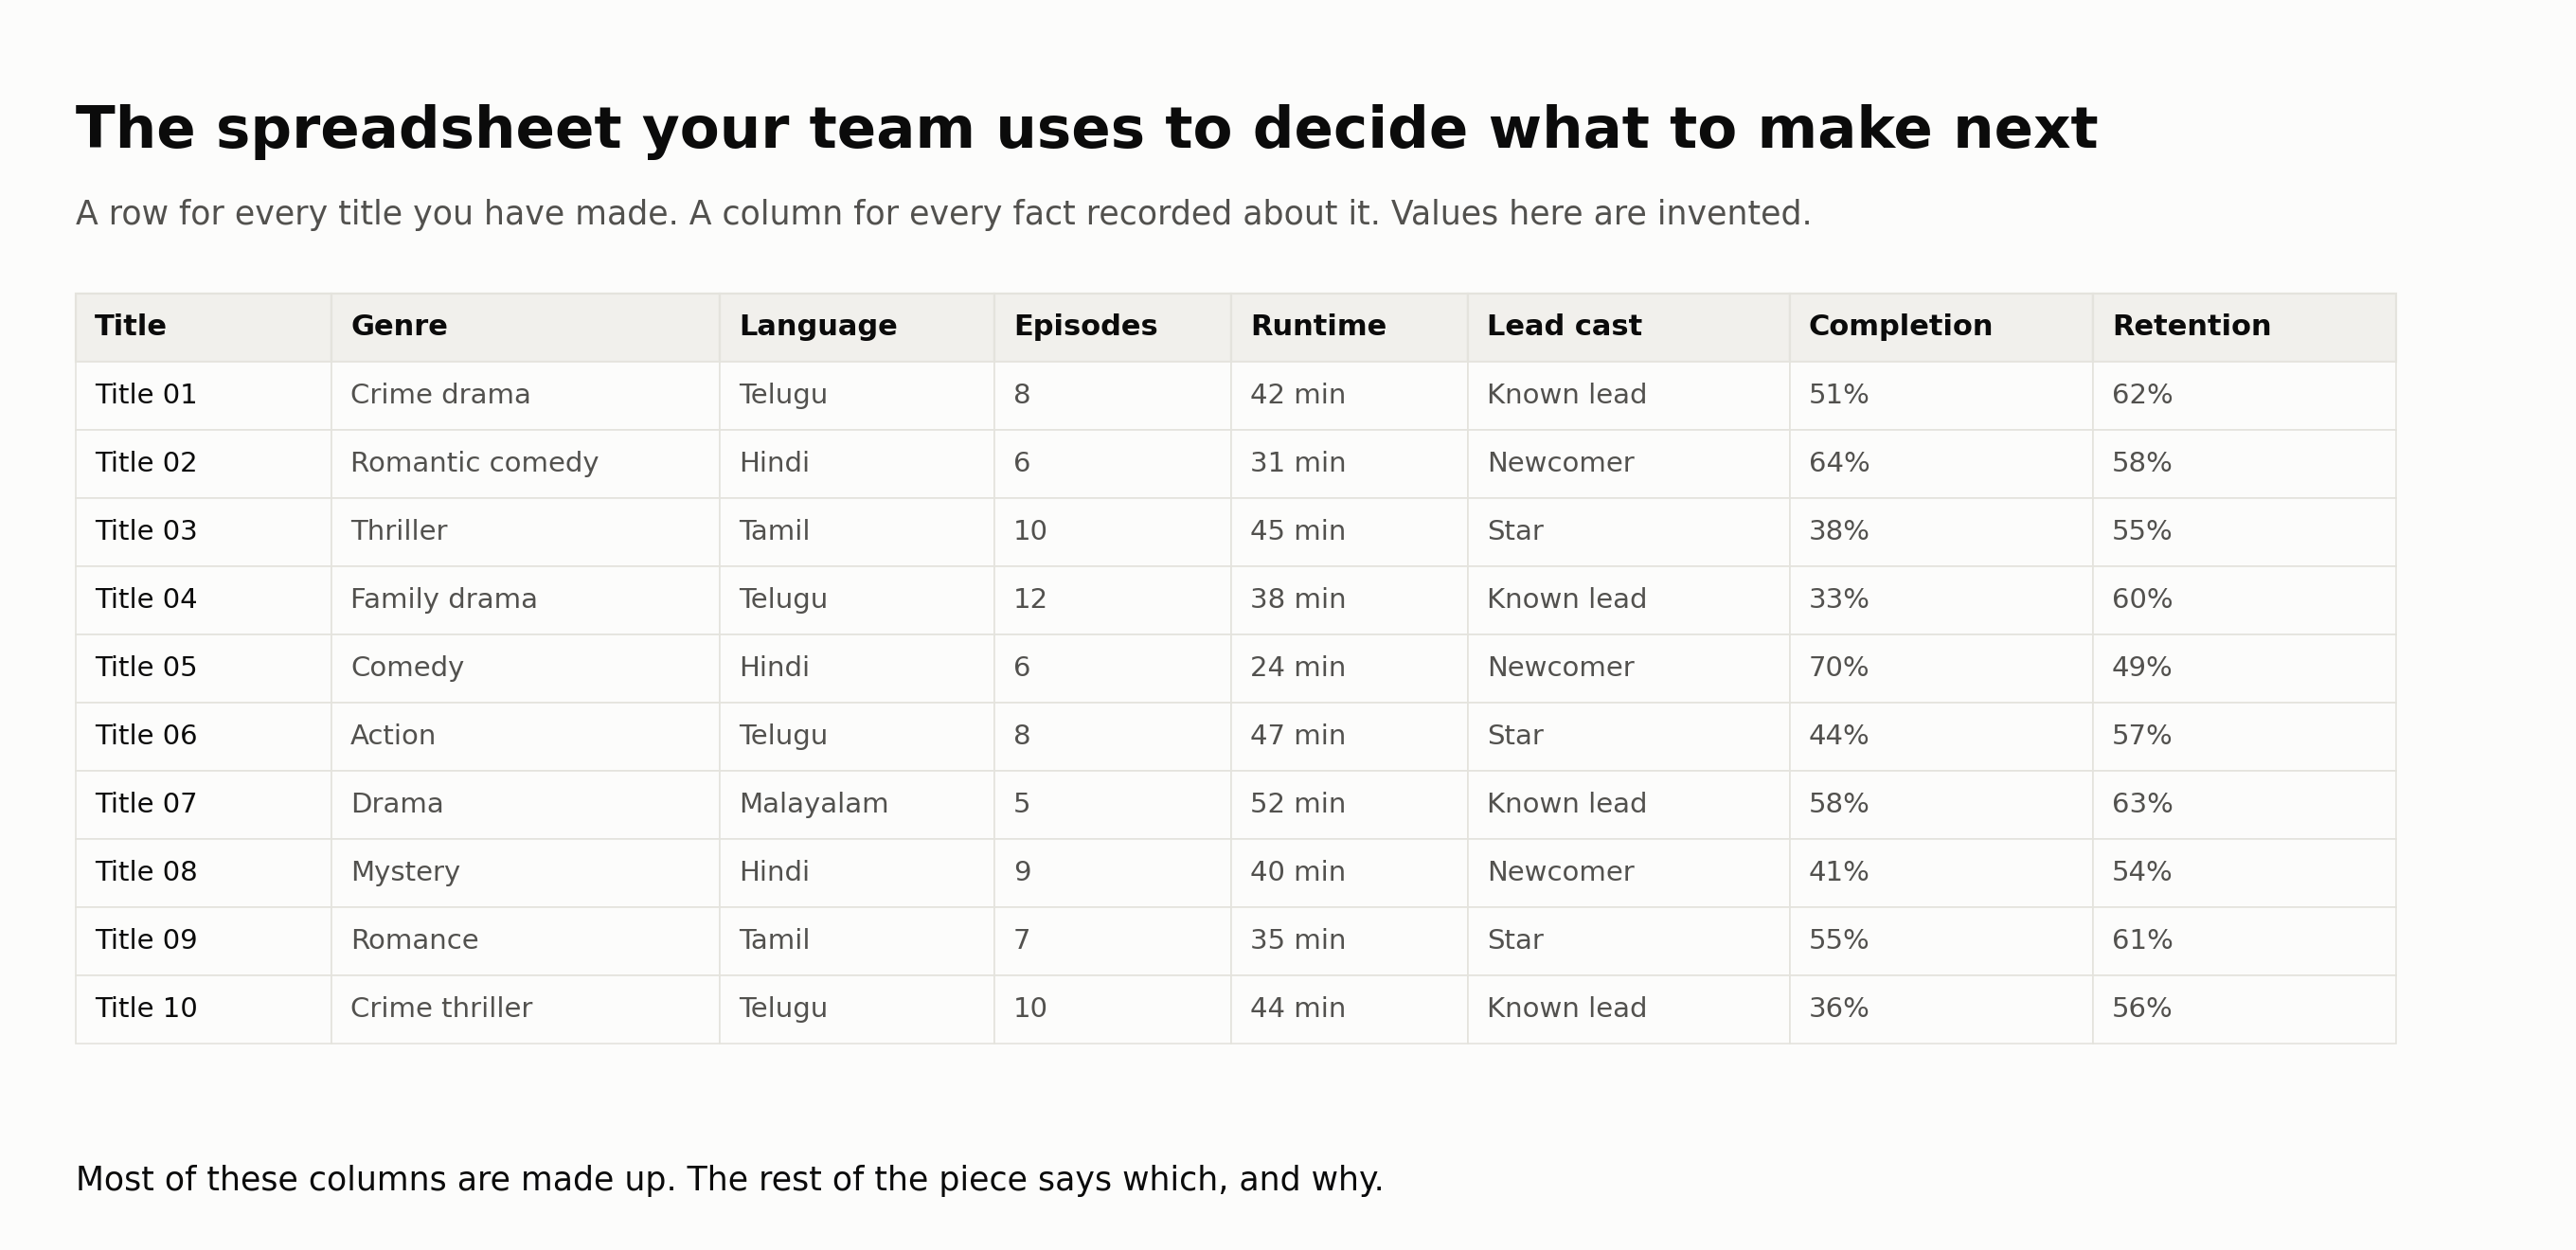
The commissioning spreadsheet: a row for every title, a column for every fact. Values invented.
I want to make a claim about that table and then spend the rest of this piece proving it.
Most of the columns are made up.
Netflix pays people to rate how much romance is in a film on a scale of one to five. Three commercial databases could fully agree on the genre of only one film in five. No published study has measured what the length of an episode does to anything. And the one column with a number behind it rests on a word nobody has defined.
There is a second claim, about the rows, and it is worse. That is the next piece.
Before the claim, the words. I am going to fix each one before I use it, so that if you disagree with where this ends you can point to the exact step where we parted.
Half of every slate argument is about what the words mean
The commissioning room is where the decision about what gets made is taken: the people who read the script, hear the pitch, weigh the cast and say yes or no. It has different names in different companies. Every “room” in this piece is that one.
A title is one thing you commissioned. A feature, a series, a documentary, an unscripted format, a vertical short drama. This series treats all of them as instances of one decision, and I will come back to whether that is fair.
The table is the spreadsheet above: one row for every title you made, one column for every fact you recorded about it.
An attribute column is a fact about a title that exists before the title is released. Genre, language, episode count, runtime, cast, showrunner.
An outcome column is a fact that exists only after release. Completion, retention, revenue.
A real column is an attribute column that passes four tests. It is fixed before the outcome exists, so you are not explaining a hit with something the hit caused. It means the same thing to everyone who fills it in. It varies across your titles enough to carry information. And somebody has written down what it means and held that definition still. That is not a demanding bar. It is the bar.
Agreement is what happens when two people, looking at the same title independently, write the same value in the same cell.
A star is a person the audience shows up for. Popularity is attention that has already piled up around a person, for whatever reason. The industry uses the two words interchangeably. I am defining them apart because the proofs below need them apart.
Completion is the share of viewers who reach the end of a title, under a stated rule for what counts as a viewer, what counts as reaching, and what counts as the end. Without that rule it is a word, not a column.
Now take the columns one at a time, in the order the commissioning room trusts them. Genre first, because it is the one everybody believes in. Then the star, because it is the one everybody argues about. Then the two a commissioner sets with their own hands, runtime and the showrunner. And last, the one column that turns out to have a number behind it.
Genre disagrees with itself. That is not my claim; it is the research’s.
Start with the column everybody trusts.
In 2006 a researcher at the University of California, Davis, needed each film’s genre for a study, so she took the labels from three commercial databases and compared them across 949 American films released between 2000 and 2003.
Roughly one film in five carried the same labels in every database that listed it. Her measure of agreement, on the same films, averaged 0.619 where one is perfect (Hsu, Administrative Science Quarterly, 2006). Her example is September 11: a drama in the first database, a documentary in the second, a war film in the third.
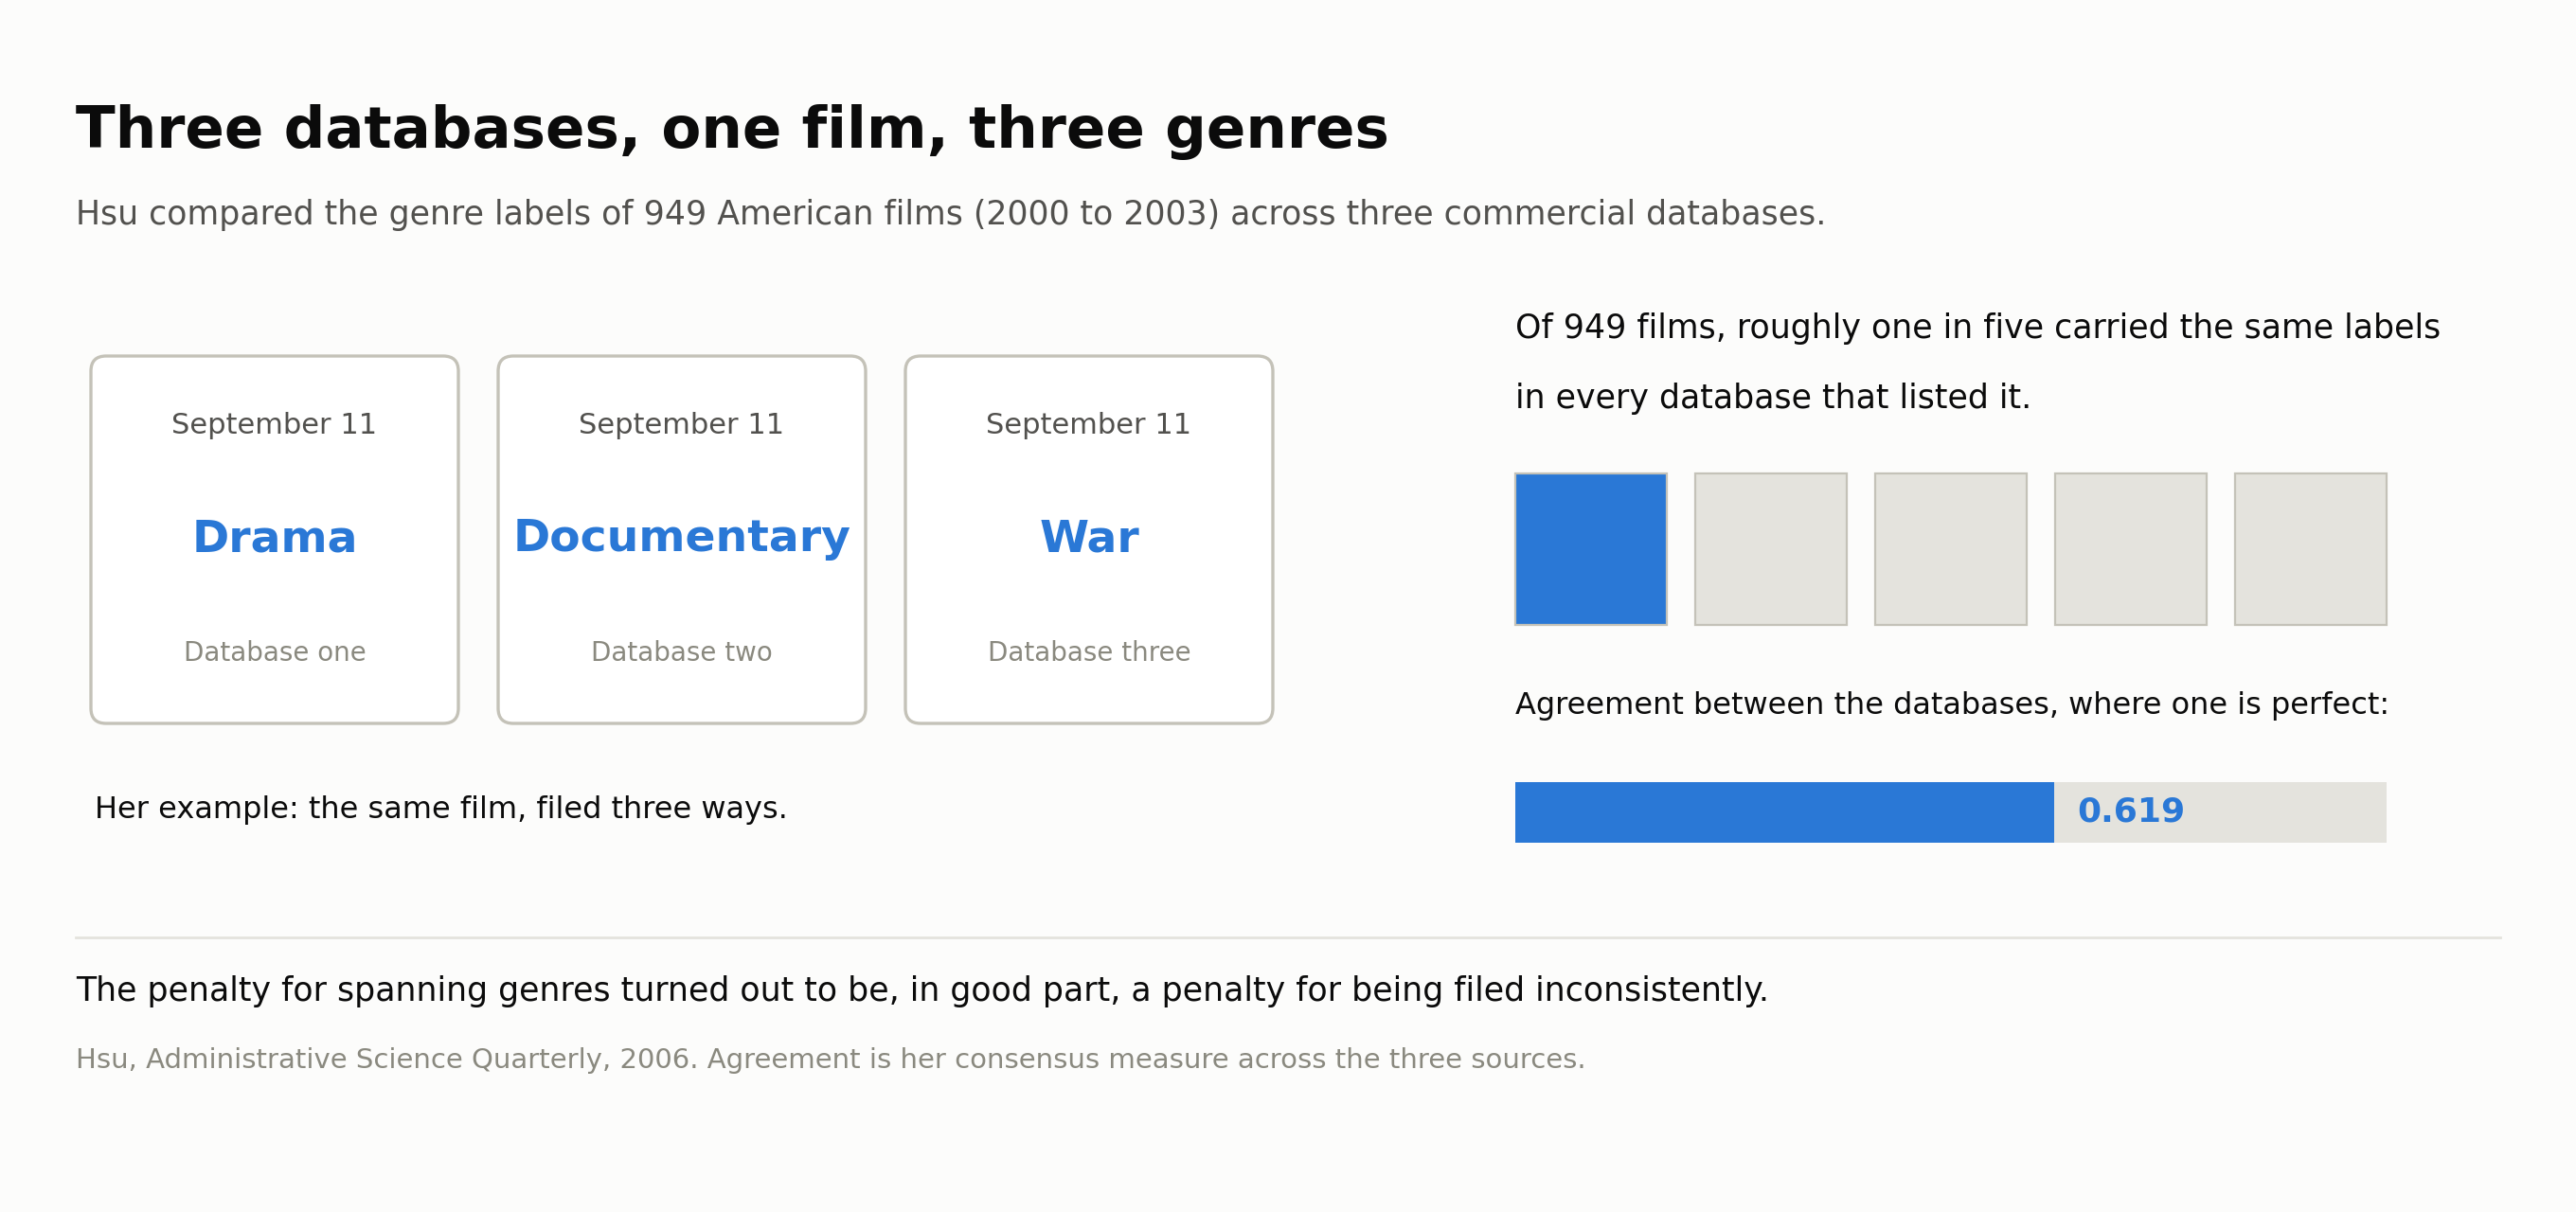
Three databases, one film, three genres. Of 949 films, roughly one in five carried the same labels in every database that listed it.
That number is not a footnote in her paper. It is the paper. She found that films spanning several genres get rated lower, and then found that the agreement between the databases explains a good part of that. The penalty for spanning genres is substantially a penalty for being filed inconsistently. The most-cited finding about genre in the literature is partly a finding about paperwork.
It gets stranger the closer you look. The Internet Movie Database, IMDb, publishes definitions for 28 genres and marks each one objective or subjective in its own help pages (IMDb). Animation is objective: over 75 percent of the running time. Short is objective: under 45 minutes. Drama is marked subjective. That is honest work, and it is rare. The Movie Database, for one, lists nineteen genres and publishes no definition for any of them.
Here is what that means for your table. If two people look at the same show and write down two different genres, the genre column is no longer telling you anything about the show. It is telling you how each of those two people felt about it. Three professional databases, whose whole job is to label films, could agree completely on only one film in five. Your team is not going to do better. So the genre column is not a fact about the show. It is a vote about the show.
Which leaves the real question. If the professionals cannot agree on what a film is, what exactly are they disagreeing about? The company that tried hardest to find out did not find a category. It found a feeling.
Netflix tried to define genre properly, and built a feelings scale
In 2006, by Alexis Madrigal’s account in The Atlantic (Yellin himself has elsewhere said 2008), Todd Yellin, then running product at Netflix, shut himself away with a couple of engineers and wrote a document he later called, in his own words, “our pretentious name”: Netflix Quantum Theory. What the document did was set out how to describe a film to a machine. It did not ask which genre a film belonged to. It broke each film into parts — how much romance there is, how much violence, how the story ends, what kind of person the lead character is, and so on — and gave each part a score.
Netflix then hired people to watch films and fill those tags in. They received a 36-page training document that, as Madrigal reported it, taught them to rate a title on “sexually suggestive content, goriness, romance levels, and even narrative elements like plot conclusiveness”. The document covered how a film ends and the “social acceptability” of its lead characters.
And the values are not categories. They are scales, many running from one to five. Romance gets a level. Gore gets a level. Madrigal again: “Every movie’s ending is rated from happy to sad, passing through ambiguous.”
Sit with what that is. The company that has tried hardest to describe its own catalogue precisely enough to act on did not end up with a list of what things are. It ended up with a set of dials measuring how a thing makes you feel: how romantic, how gory, how resolved, how far you can approve of the person you are watching.
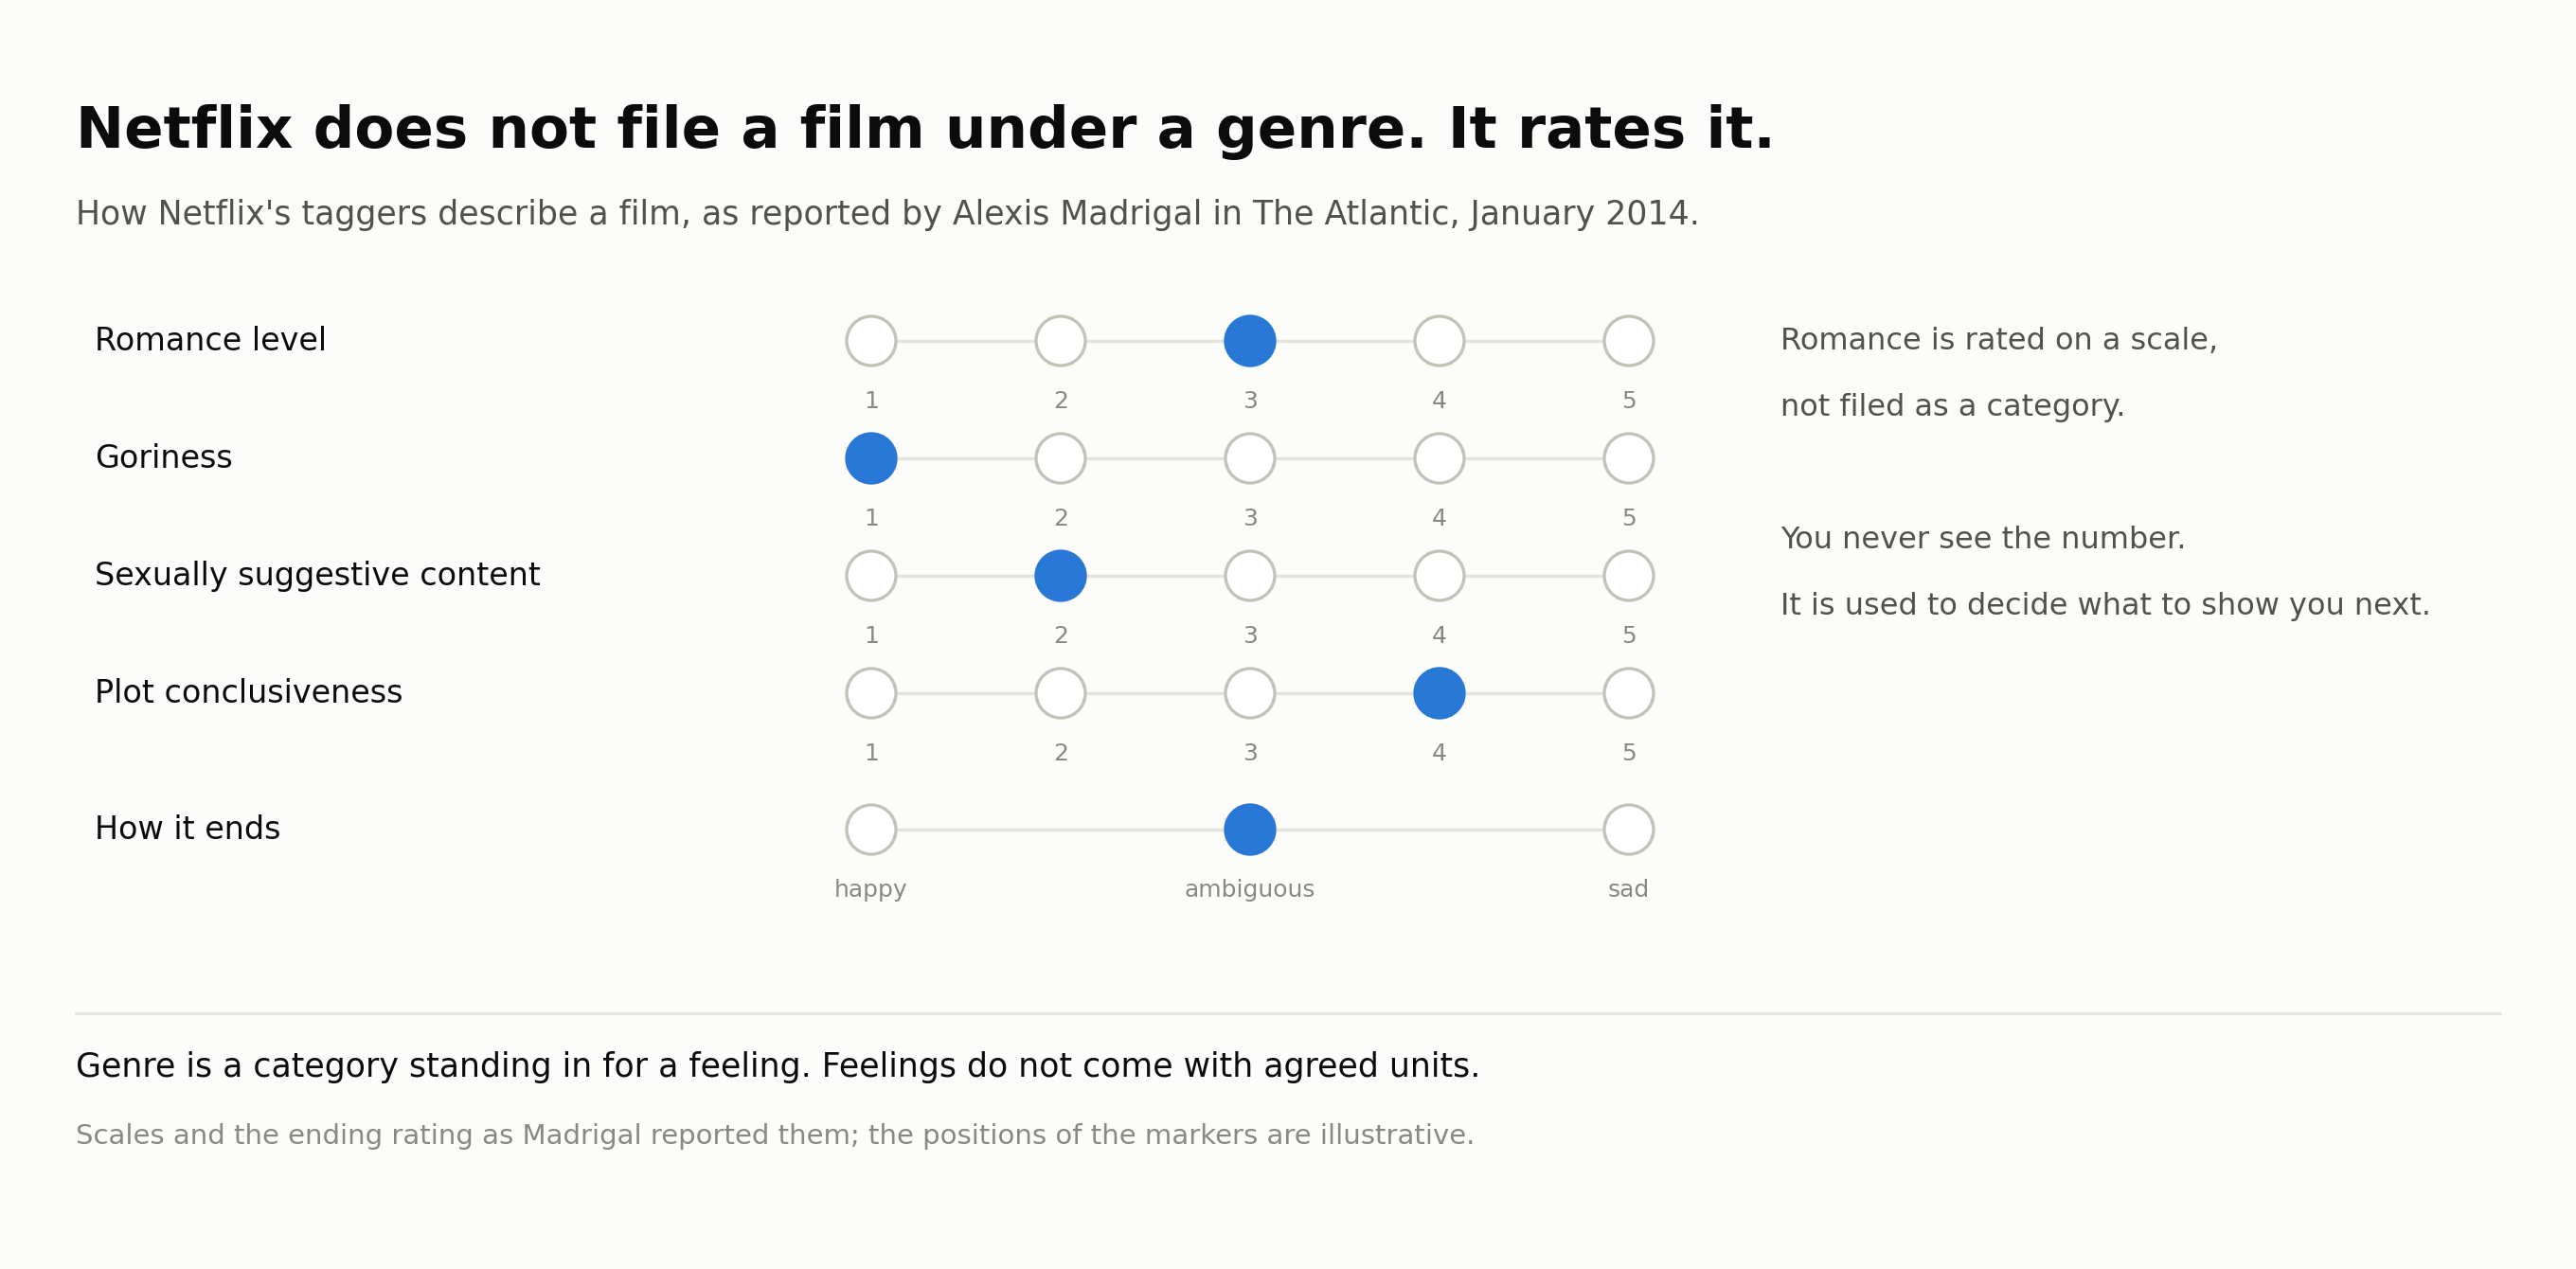
Netflix does not file a film under a genre. It rates it.
Notice who that score is for. You, the viewer, never see it. Netflix does not put “romance: four out of five” on the screen. It keeps that number inside the system and uses it to decide which film to show you next. So a tag at Netflix is not a label that describes the film to a person. It is a number that predicts which people will watch the film.
So here is what genre is, once you follow it down. It is a category standing in for a feeling. Which is fine. That is what it has always been, and it is why the word is useful in the commissioning room. It is also why it cannot be a column. You can compare two runtimes because a minute is a minute for everyone. You cannot compare two people’s sense of how romantic a film is, because there is no unit of romance that means the same thing to both of them. That is why three databases could not agree in the last section, and it is why yours will not either.
This is not history. As recently as late 2024 Netflix was advertising for content analysts on a team it called Product Metadata and Ratings, “a team of classification experts”, in its own words, “people who can identify, collect and transform the artistic qualities of films and series into the data that powers personalization for millions of people around the world.”
That is the first column, and it fails on its own terms: nobody can agree what goes in it. The second column, the star, fails differently. There is a number behind it. It is just not the number you think.
Stars sell tickets. Fewer than you think, and some sell none.
Star power is the attribute everyone believes in and almost nobody has tested honestly, and the reason is a trap that is easy to state and hard to escape. Stars do not get cast at random. They get attached to the films that already have the biggest budgets, the strongest scripts and the widest releases: the films that were going to be big anyway. So if you simply compare films with stars against films without them, the films with stars win, and you cannot tell how much of that was the star and how much was everything else the star was attached to. Call it the casting trap.
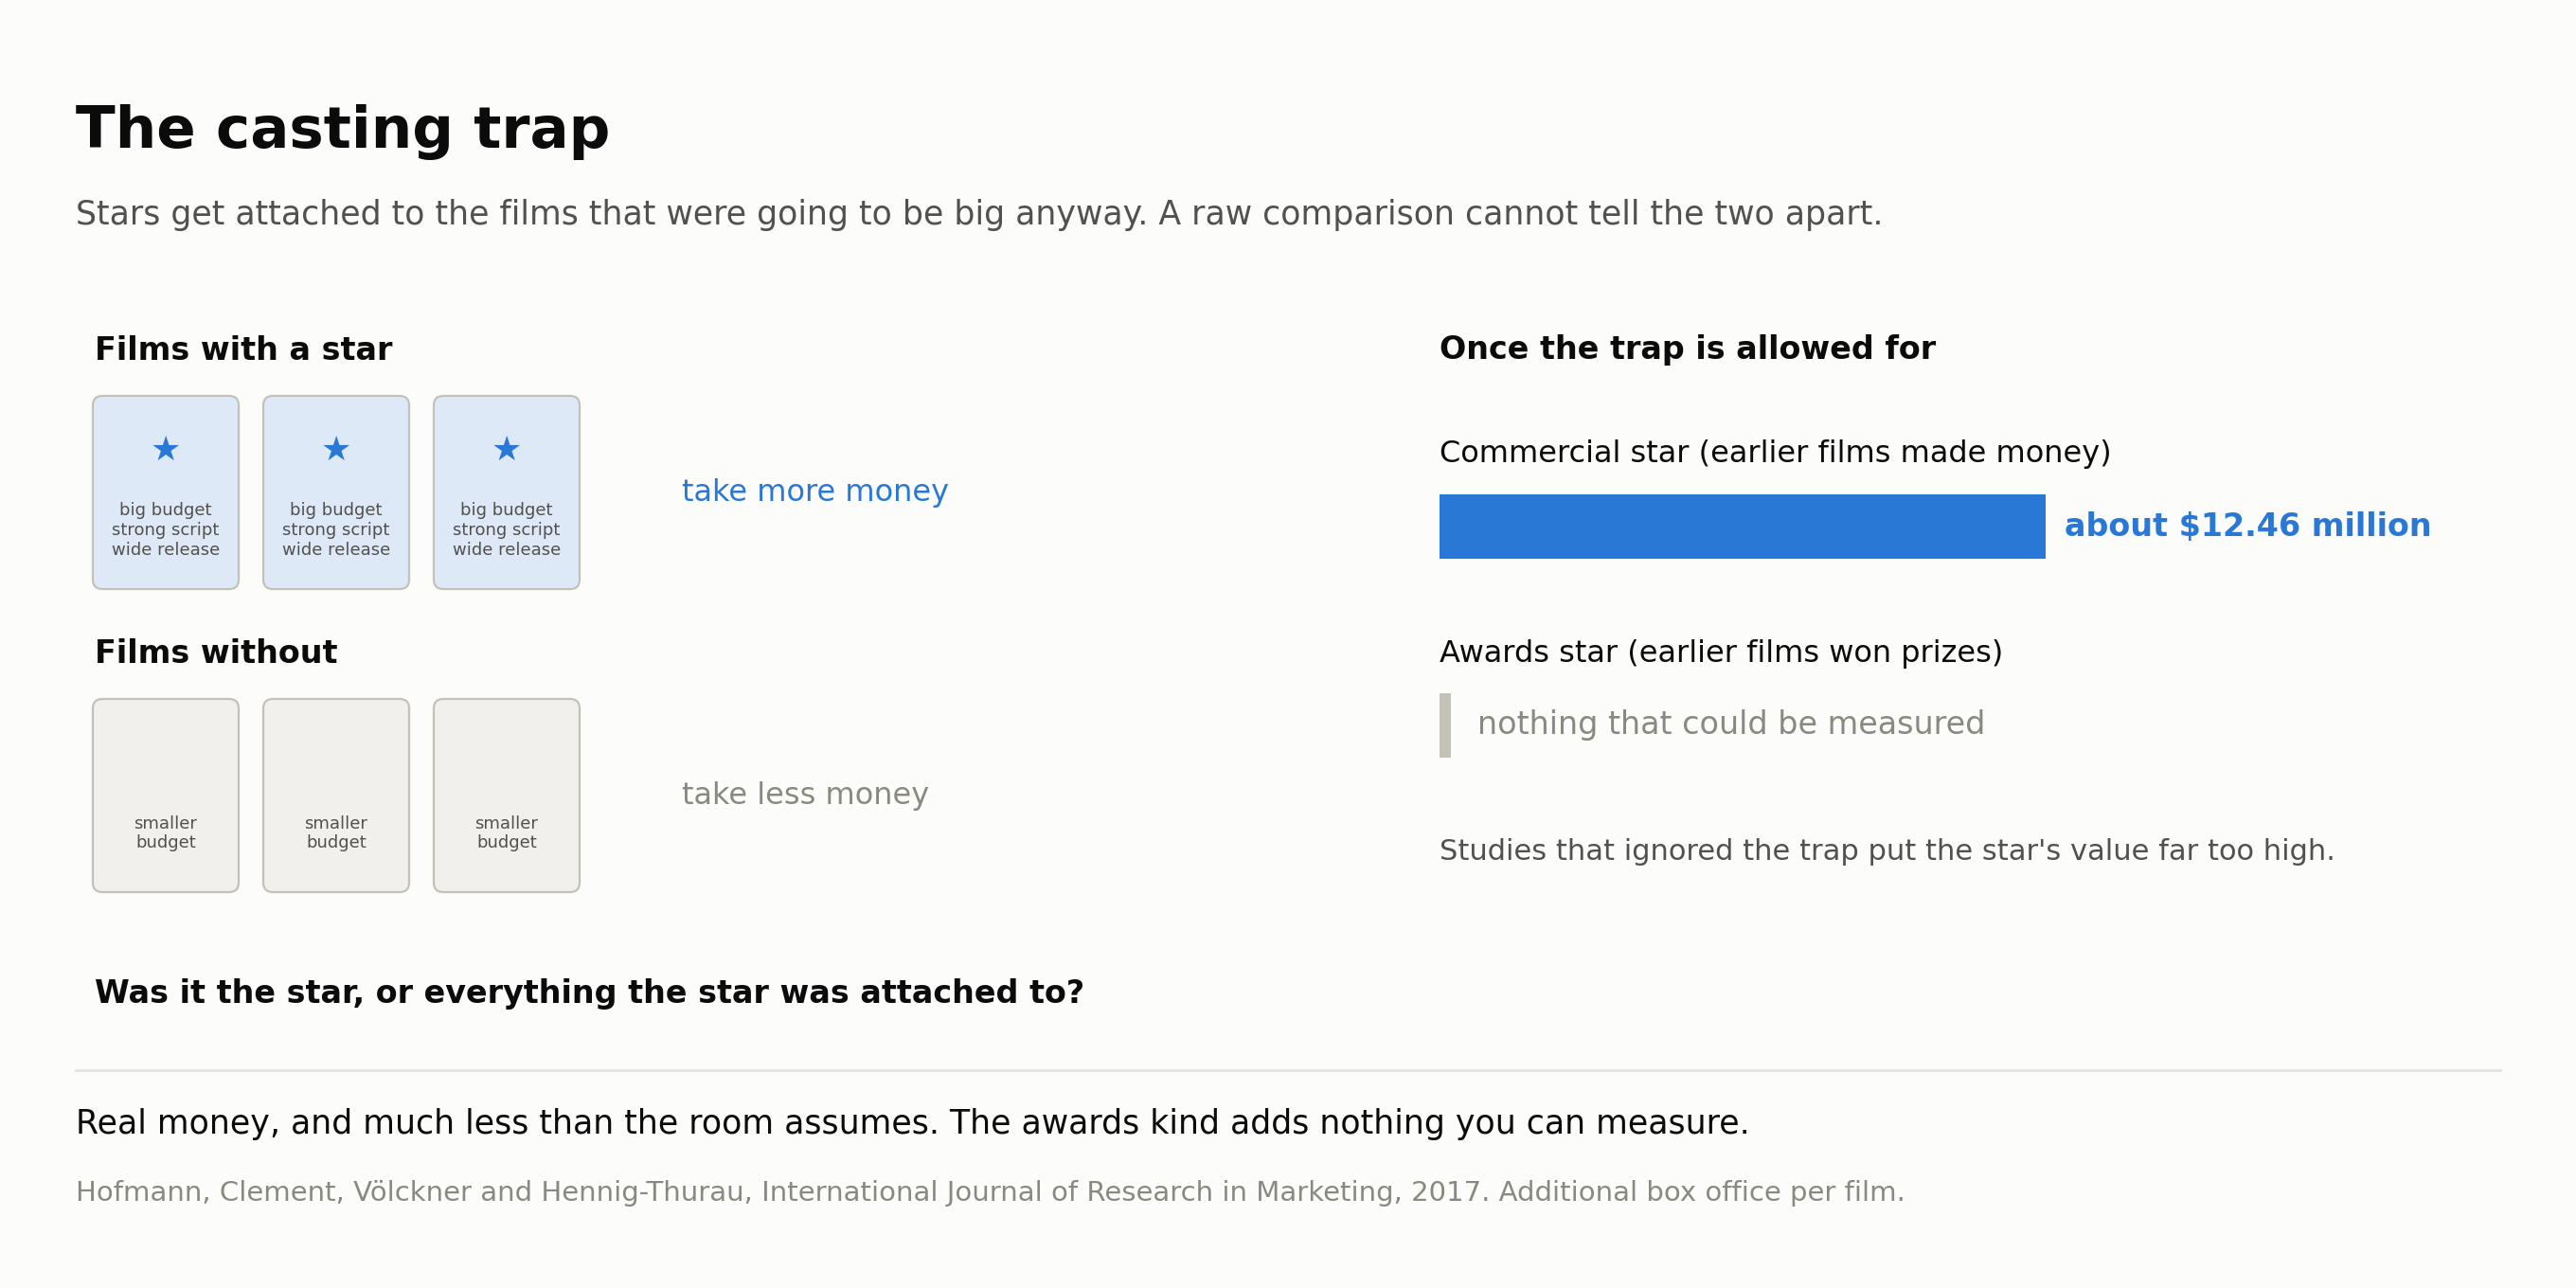
The casting trap, and what a star is worth once it is allowed for.
When somebody finally corrected for the casting trap, the picture shrank. The research separated stars into two kinds and measured each. A commercial star is an actor whose earlier films made a lot of money: the name on the poster that makes people buy a ticket. An awards star is an actor whose earlier films won prizes: the name critics respect, whether or not the public queues. Three findings came out. First, the earlier studies that had simply compared films with stars against films without them, and so had counted the big budgets and strong scripts as if they were the star’s doing, had put a star’s value far too high. Second, once the casting trap is allowed for, a commercial star adds about 12.46 million dollars to a film’s box office, which is real money and much less than the commissioning room assumes. Third, an awards star adds nothing that could be measured, and the films that had one took less money than the films that had a commercial star. If you want the method, the paper is Hofmann, Clement, Völckner and Hennig-Thurau in the International Journal of Research in Marketing, 2017, and it is here. In the commissioning rooms I have sat in, in India, nobody has ever meant the awards kind when they said “star”; the distinction barely exists here, and 12.46 million is the number for the star they do mean.
So what is behind the star column? For the commercial star, a real number: about 12.46 million dollars a film, which is a great deal less than the commissioning room believed before anyone corrected for the casting trap. For the awards star, nothing that can be measured. So the column is real. But a real number can still be measuring the wrong thing, and this one is.
A star and a famous person are not the same column
Take the star column and ask what it is actually recording. It is recording attention: how many people notice that this actor is in this film. But attention comes in two kinds, and they are not the same thing. There is the attention an actor earns, because people have watched their work and want more of it. That is a star. And there is the attention that has simply piled up around a person — from gossip, from a scandal, from a marriage, from being everywhere for a season — whether or not anyone has seen them act. That is a famous person. In the commissioning room, the two words are used as if they meant the same thing. Most of the research makes the same mistake: in several major papers, how famous someone is stands in for how much of a star they are.
Where somebody has pulled the two kinds of attention apart, they behave differently.
One researcher, Julianne Treme, counted how often an actor appeared in People magazine and split the appearances into two piles: the ones the studio arranged as part of the film’s promotion, and the ones that happened before the promotion began, when nobody was paying for coverage. She found that the promotional appearances made no measurable difference to the film’s takings. The appearances from before the campaign did. Same magazine, same actor, same kind of attention. Only the kind the studio did not buy converted into tickets. The paper is in the Journal of Media Economics, 2010, and it is here.
Other studies point the same way. The attention a star brings arrives in the first week or two of release and then fades; it does not carry a film through its run. And in one study of Chinese films, an actor’s social-media following was, on its own, bad for the box office; it helped mainly by getting people talking about the film.
This is the argument every marketing meeting has: does a large following sell? Two studies have answered it. The first gathered every published result it could find on influencer marketing, covering more than two million people, and found that the number of followers an influencer has makes no measurable difference to sales. The second looked at 802 Instagram campaigns and found that engagement rises as an account’s following grows, then falls once the following passes about 1.4 million. The biggest names get less response than the middle-sized ones. A following is fame, and fame on its own does not sell. The papers are here and here.
Now put that beside what a star is worth to a film. It has been measured three times, by three different methods, and the three answers were about 16.6 million dollars, about 3 million dollars, and about 12.46 million dollars. The biggest of the three came from the study that measured a star by how many people looked up the actor’s page on the Internet Movie Database. That is a count of fame, not of star power, and it produced the biggest number. The papers are here, here, and the one in the last section.
Look at what the three numbers are telling you. When a study counted fame, it found a star worth about 16.6 million dollars. When the studies counted something closer to star power, what an actor’s earlier films had actually earned, they found about 3 million and about 12.46 million. The difference between the big number and the smaller ones is the part of an actor’s value that is only fame: attention that has piled up around the person and does not turn into tickets. That is the gap between a star and a famous person, in money. Every casting conversation runs into it, when a name that everyone knows is priced as if everyone would show up for it. Nobody has ever measured the gap on purpose, as a figure a commissioner could use. It has been measured three times by accident.
And there is a third thing the star column records, which turns out to be the thing it records best.
The star column is real, and it is not doing what you think
Two studies looked at what a star changes before the audience gets a say. The first modelled how studios and stars choose each other, and found that a star’s presence had a much stronger effect on how many cinemas booked the film than the film’s own characteristics did, while the difference in takings between films came entirely from the films’ characteristics, not from the star. The second, from years earlier, simply counted: a film with a star opened on about 126 more screens, about 18 percent more, and by its fifth week was on about 359 more screens than a film without one. The papers are here and here.
Put that beside the last two sections. A star does move tickets, by a smaller amount than the commissioning room believes. But the star moves something else by more, and moves it first: how many screens the film gets. And screens are not the audience’s decision. They are decided by exhibitors and distributors before a single ticket is sold, on the strength of the name.
So the star column in your table is doing two jobs, and the one it does most reliably is not the one you read it for. It records what you were able to negotiate: the release you got because of who was in it. You have been reading it as a record of what people wanted to watch.
That is cinema. On a streaming service the screen is the home page, and the question is who decides what goes on it. I found no study that tests a star against anything a streaming audience does. But there is a case that shows the mechanism in the open, and it is the biggest title Netflix has ever had.
Squid Game cost about 21.4 million dollars for a nine-episode season, by figures Bloomberg saw in Netflix’s internal documents. Its creator, Hwang Dong-hyuk, had spent about ten years trying to sell the script and been told it was too unrealistic and too violent to be commercial; Ted Sarandos put it as “ten years trying to sell the show”. Its lead was one of Korea’s most successful actors, its breakout star was a model in her first acting role, and Netflix’s own head of global television said afterwards that they had expected a big regional hit and could not have imagined what happened. Whether any of the cast meant anything to a viewer outside Korea, no source says in terms; my reading is that the cast was not what Netflix was betting on.
Within four weeks, 142 million member households had watched it. It was the number-one title in 94 countries. Netflix told its shareholders it was the biggest television show it had ever had, and the internal documents valued what it brought in at about 891 million dollars, more than forty times what it cost.
Now look at how it got its screens. There is no launch campaign on record, and Netflix’s chief marketing officer has since described its marketing outside Asia in 2021 as “largely reactive to what audiences were excited about”. What Sarandos credited, in the week the numbers came in, was the delivery system: an interface that “recognizes and helps them figure out how to find the show they’re going to love, even if they’ve never watched a show from Korea”. Netflix’s home-page rows are rebuilt every day on what is relevant to you and on what everyone else is watching, and its engineers have written that the ranking “needs to respond quickly when a title launches”.
So on a streaming service the screens are allocated after the audience votes, not before, and by a machine reading the first days of viewing. That inverts the cinema result. In cinema a star buys the screens before anyone has seen the film. On Netflix, a show with no bankable name and a script nobody had wanted for a decade earned the whole home page by being watched, and the star column had nothing to do with it. Which means the star column on a streaming service records even less than it does in cinema. There is no distribution deal for the name to buy, because the distribution is decided by what happens in the first few days.
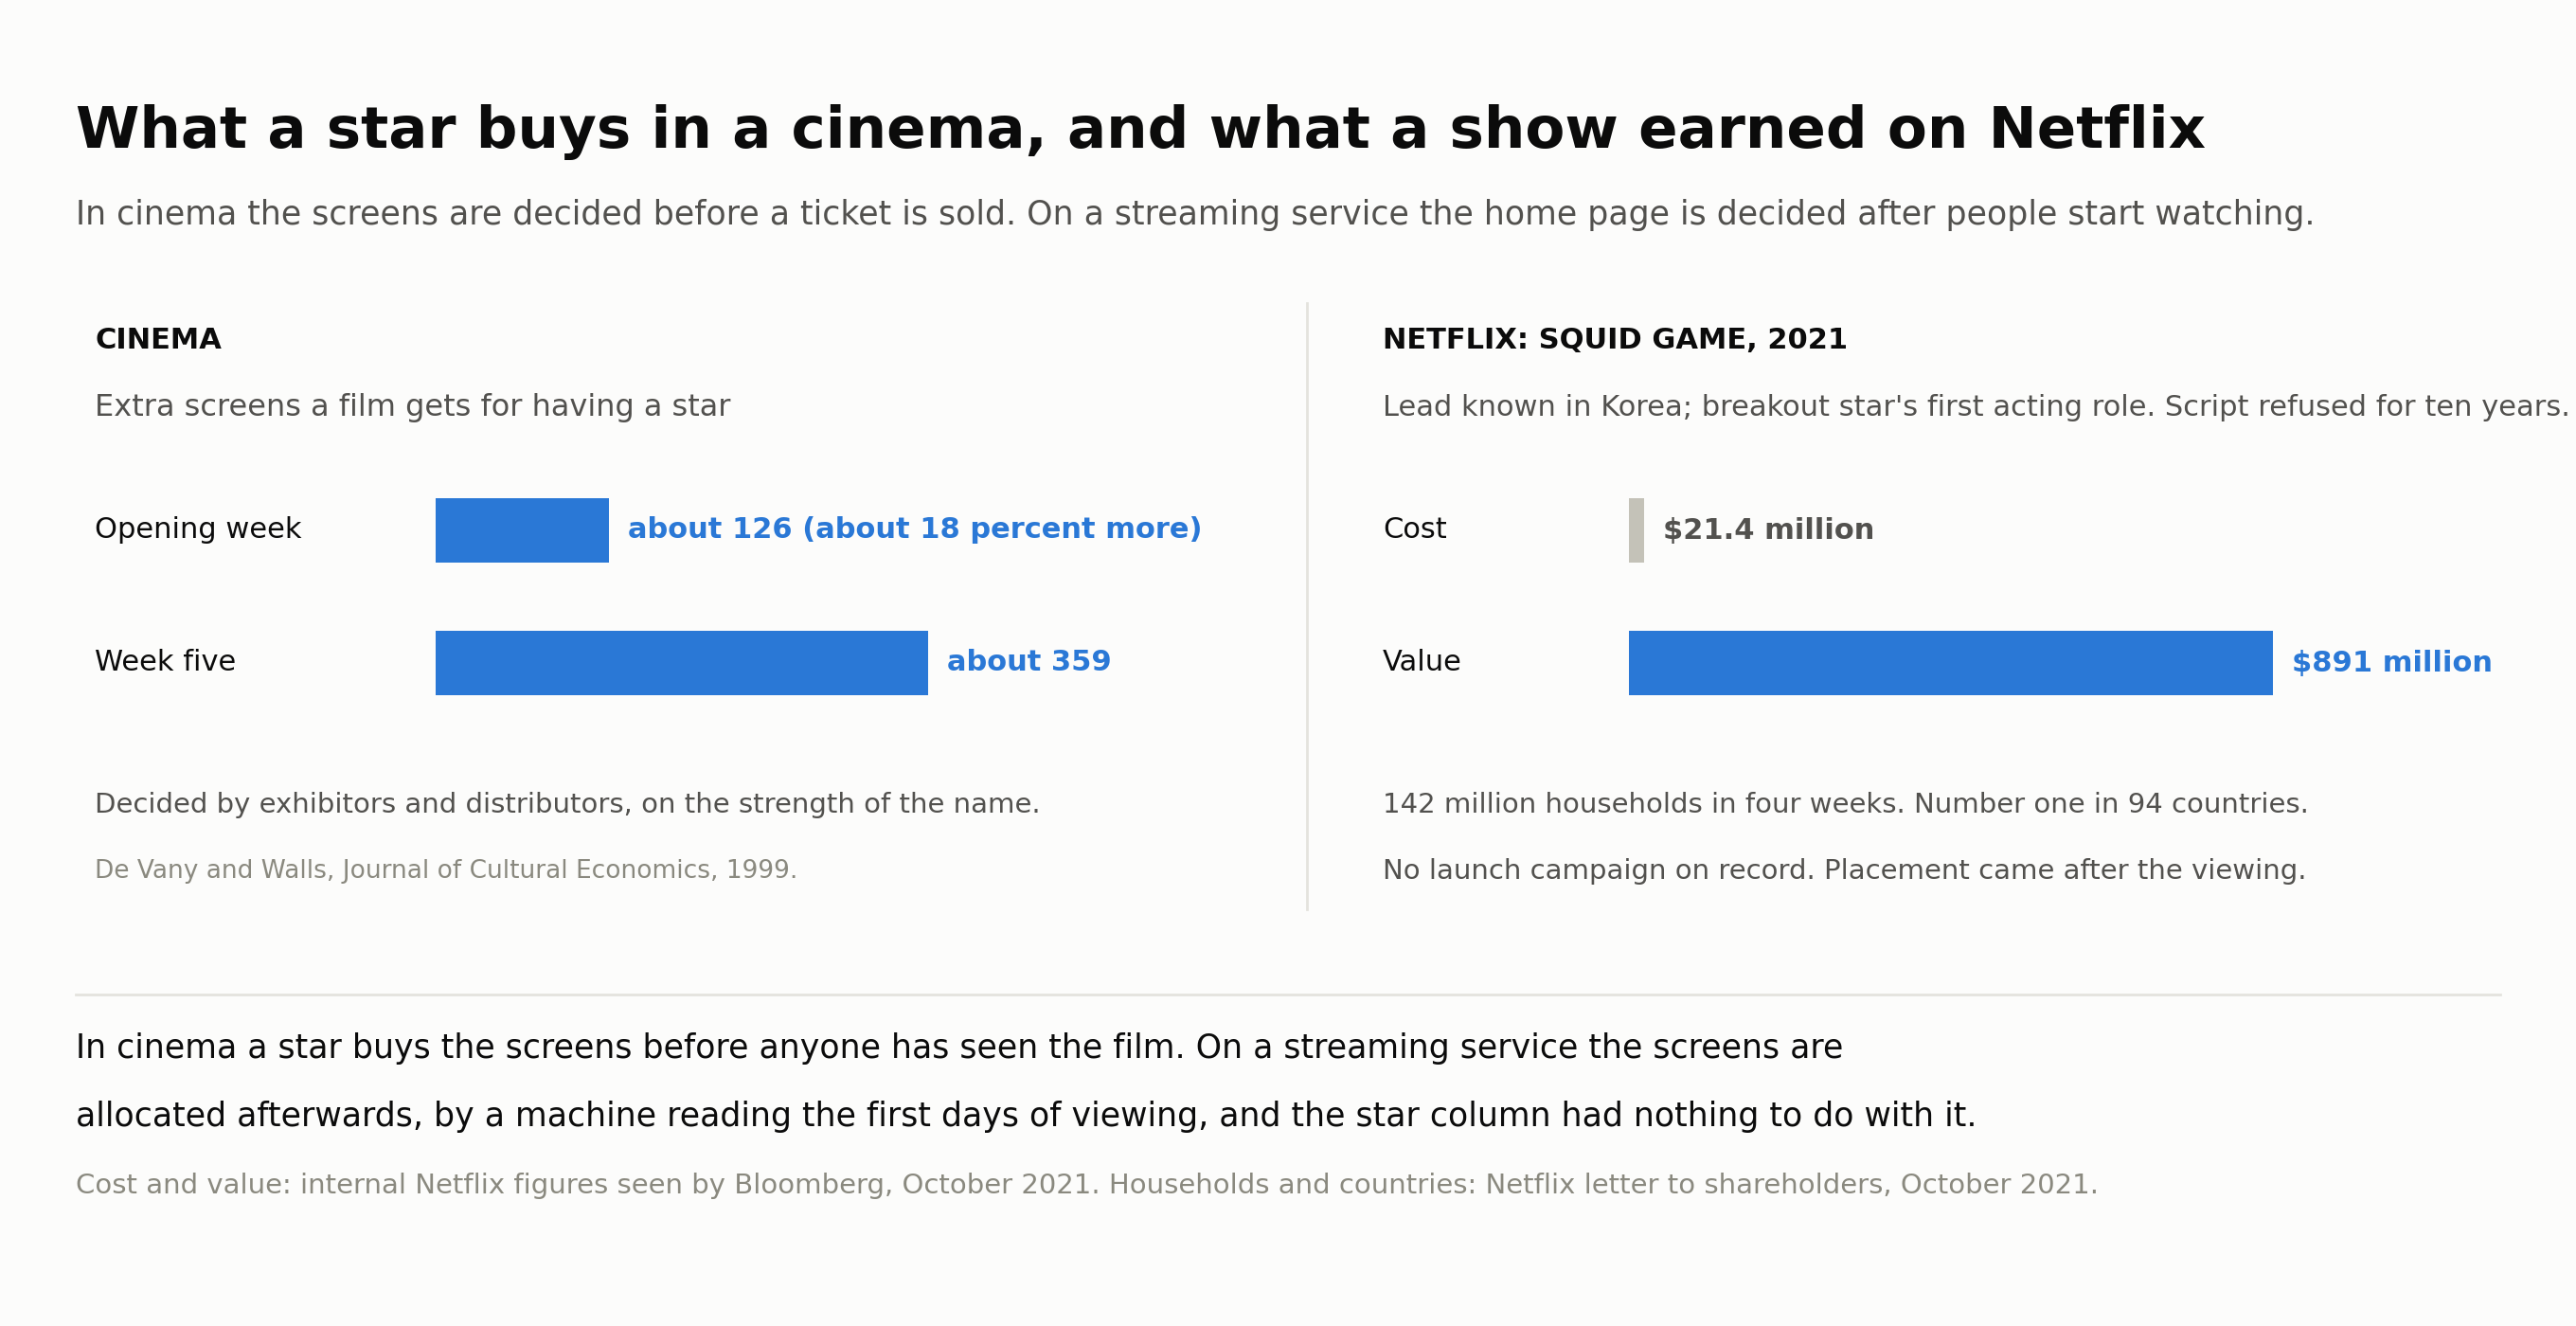
What a star buys in a cinema, and what Squid Game earned on Netflix.
And that is the thread to hold on to. If early viewing decides who gets seen, then the column that decides a title’s fate on a streaming service is not an attribute of the title at all. It is a reading of the audience, taken in the first week, by the same company that commissioned the title. Hold that. In the next piece we will see it taken to its limit.
That is the star. Now the columns a commissioner sets with their own hands, where you would expect the evidence to be thickest, and it is thinnest.
The column you control most has never been measured
Runtime is the attribute a commissioner sets most directly, and it is argued about in every writers’ room and every post-production schedule. I went looking for what is known about it. No published study relates the length of an episode to any outcome, at any length from two minutes to ninety. Not completion, not drop-off, not retention.
What that costs is visible in Netflix’s own numbers. Netflix has changed what counts as a view three times in four years, and each change reordered its own results without anyone watching anything different.
The first change came in January 2020. Until then, a household counted as having watched a title only if it had watched at least 70 percent of one episode, or 70 percent of a film. From January 2020 a household counted if it had watched two minutes. Netflix’s reason, in its letter to shareholders, was that its titles now ran from fifteen-minute episodes to two-hour films, and the old rule treated them unequally: 70 percent of a fifteen-minute episode is ten minutes, while 70 percent of a two-hour film is an hour and twenty-four minutes. Under the new rule, a viewer who watches three minutes of a film and switches off is a viewer. Netflix said the new count ran about 35 percent higher than the old one, and gave an example: Our Planet had 33 million viewing households under the old rule and 45 million under the new one. Same show, same people, twelve million more viewers.
The second change was in how Netflix ranked its titles publicly. From mid-2021 its Top 10 lists ran on hours viewed: the total time all viewers spent on a title. That favours long titles, because a long title collects hours by being long. Take a ten-hour season watched by one million people and a two-hour film watched by four million people. The season has ten million hours; the film has eight million. The season ranks above the film, although twice as many people watched the film.
The third change, in June 2023, was meant to fix that. Netflix moved its Top 10 to “views”, which it defined as hours viewed divided by the title’s runtime. Run the same example: the season’s ten million hours divided by ten hours gives one million views; the film’s eight million hours divided by two hours gives four million views. Now the film ranks above the season. And that change reordered Netflix’s own history. Wednesday, whose first season runs under seven hours, passed the thirteen-hour Stranger Things 4 as the most-viewed English-language series Netflix had ever had, not because anything happened, but because the second one is longer.
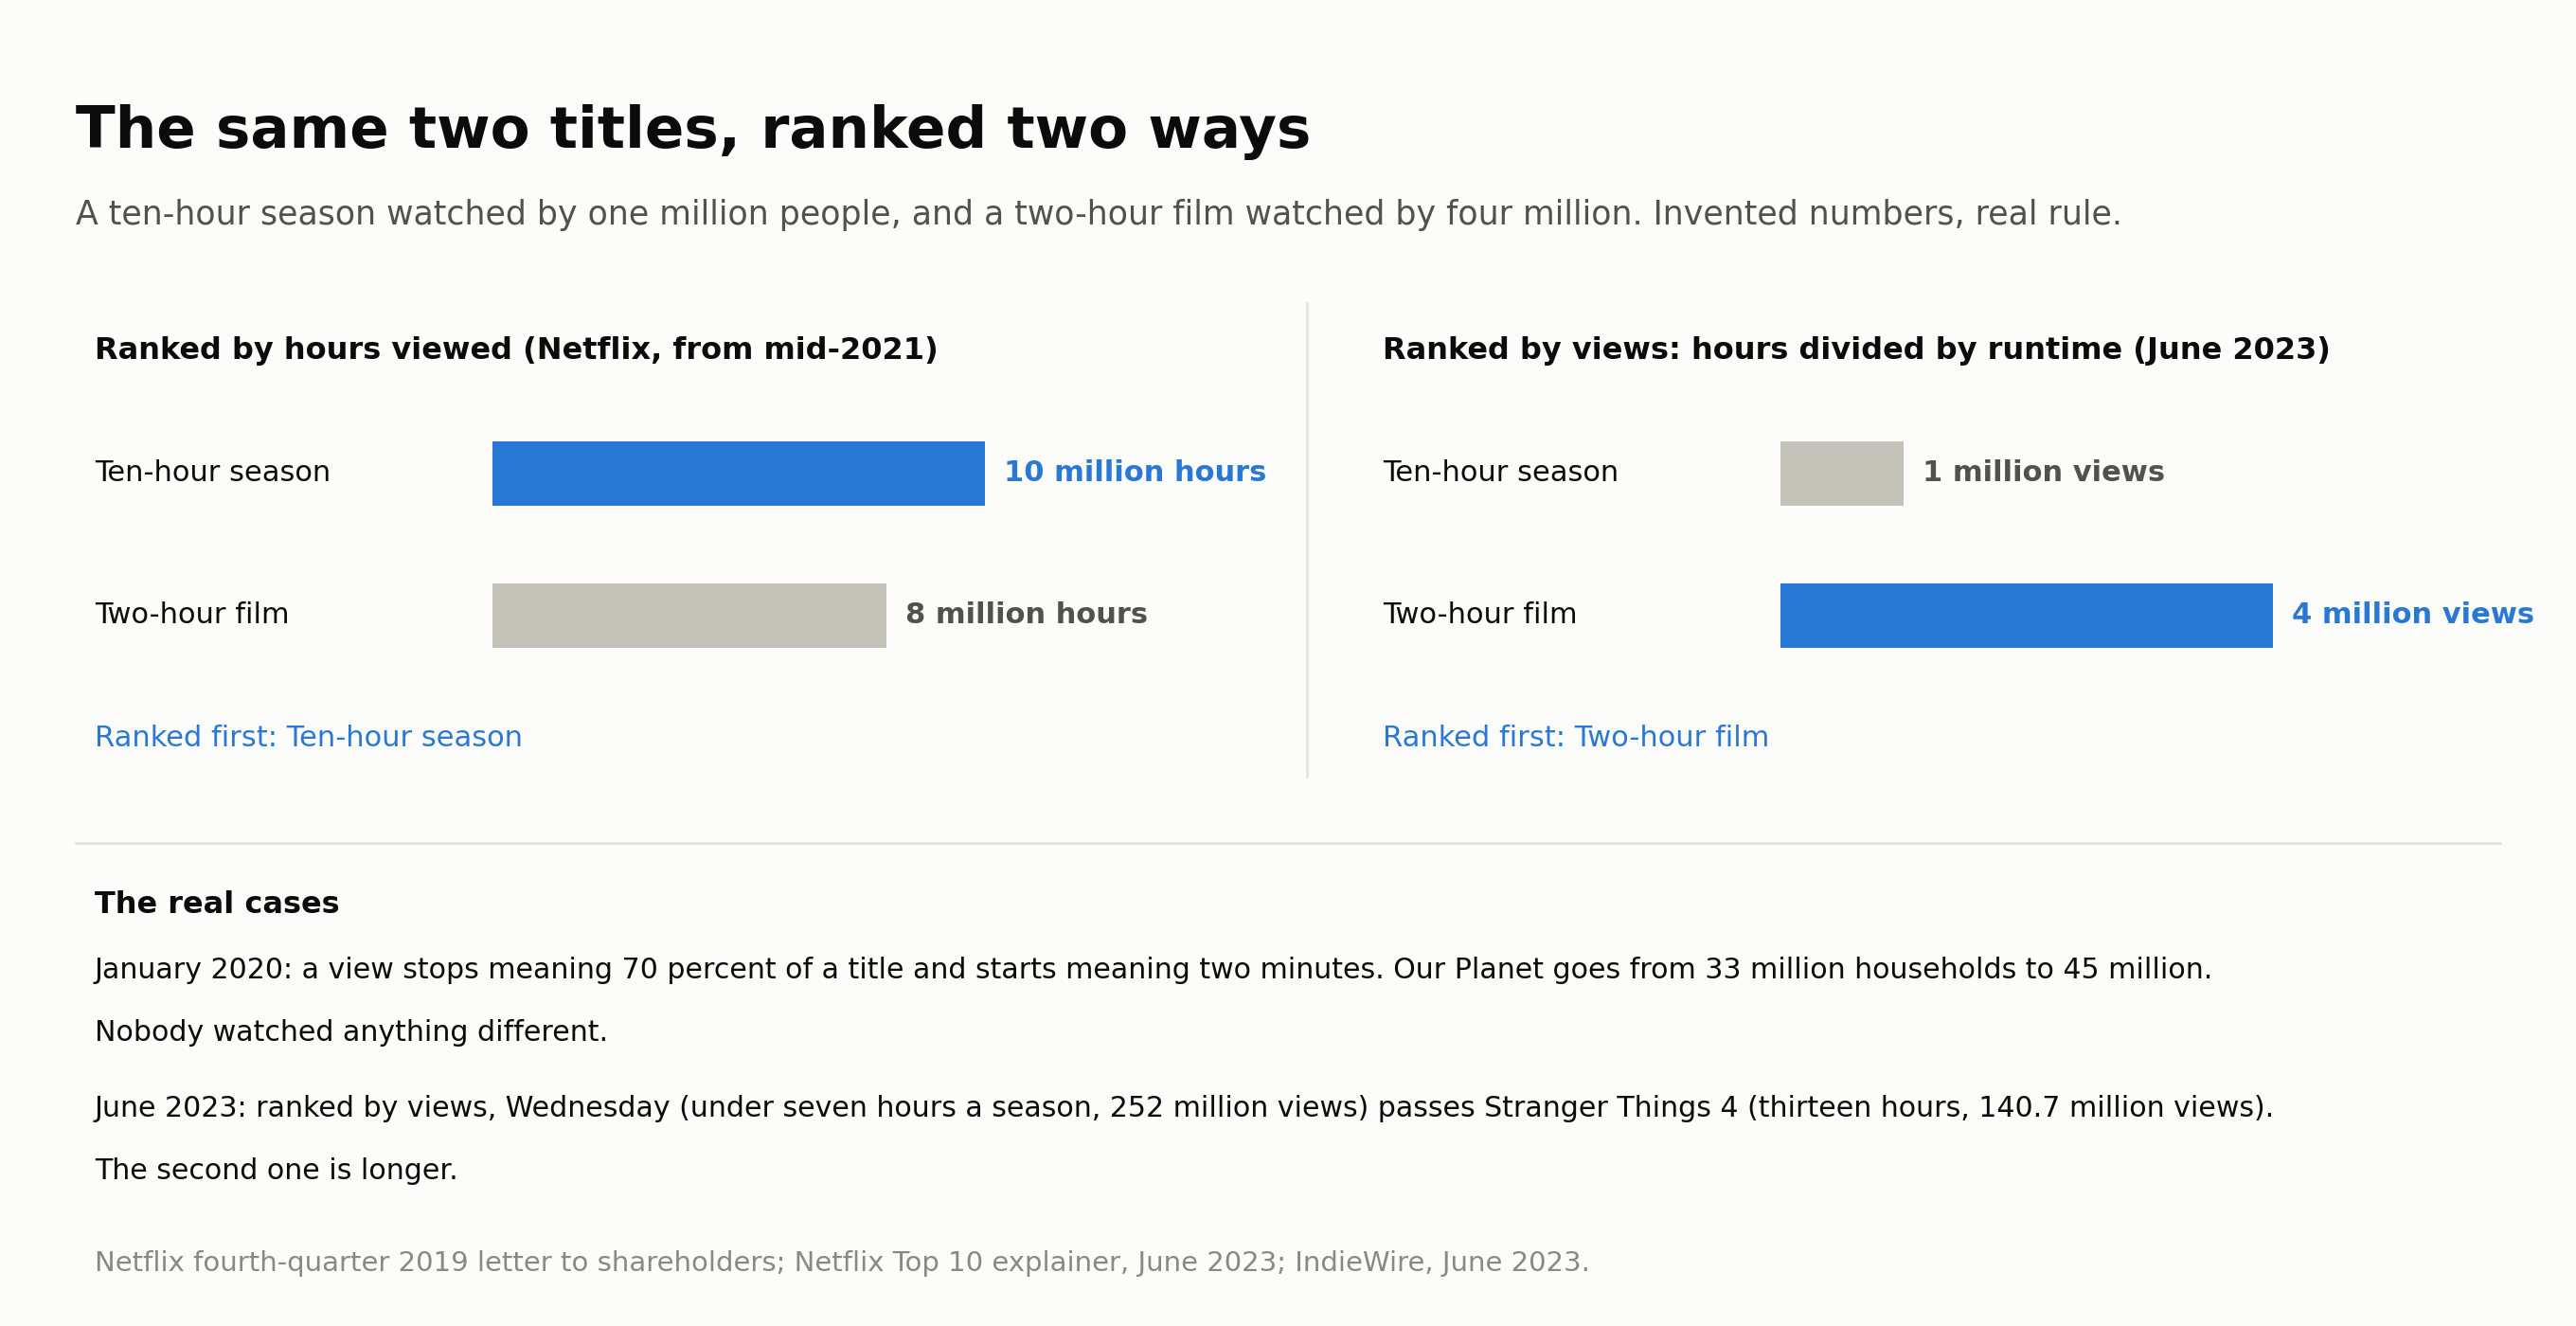
The same two titles, ranked by hours viewed and then by views.
Notice what was being corrected each time. Runtime was never measured against anything. It is the thing the measurement keeps having to be corrected for. The sources are Netflix’s fourth-quarter 2019 letter, its Top 10 explainer, and IndieWire’s report of the reordering.
Showrunner track record is the column the industry bets on most — overall deals, put pilots and packages are all bets on it — and there is no published evidence relating it to any streaming outcome. And it is the casting trap again. Successful showrunners get offered more shows, so you can never tell from the record whether the showrunner made the shows work or the working shows went to the showrunner. It is where the part of this argument about facts runs out and the part about judgement begins, and I am coming back to it in the next piece.
So this is where the columns stand. Genre is a vote. The star column mostly records your distribution deal, and on a streaming service not even that. Runtime and showrunner track record, two of the things a commissioner argues about most, have no published evidence behind them at all. Of all the attribute columns in your table, exactly one has a published relationship to an outcome. That is episode count, and it is the next section, because the evidence behind it is not as usable as it looks.
Episode count is the only column with evidence, and the evidence has two holes in it
Episode count is the one attribute column where somebody has published a relationship to an outcome, and it is the relationship everyone now quotes. Digital i measured the first seasons released in 2024 and found that seasons of three to six episodes were completed by 48 percent of viewers on average, seasons of eleven to fifteen episodes by 26 percent, and seasons of sixteen or more by 29 percent (Digital i). I have quoted those numbers myself.
There are two holes in that evidence, and I would rather point them out than have somebody point them out for me.
The first hole is the word “completion”. Remember what it has to mean: the share of viewers who reached the end, under a stated rule for who counts as a viewer and what counts as the end. Digital i has not published that rule, not on its methodology page and not in the article; its full reports are gated and I have not seen inside them (Digital i). Did a viewer have to watch every episode, or only start the last one? Within a week, or within a year? Is the share taken of everyone who pressed play on episode one, or of everyone who finished it? Each answer gives a different number. The only note I can find says completion rates were calculated for first seasons only. The cleanest number in this piece rests on a definition nobody has written down.
The second hole is that the numbers may show arithmetic rather than behaviour. Suppose viewers were equally likely to drop out after any episode, whatever the season’s length. A long season would still show lower completion than a short one, simply because it gives the viewer more chances to leave. So the finding “short seasons are completed more often” is consistent with two very different explanations: short seasons hold people better, or short seasons have fewer exits. Nobody has separated the two. And Digital i itself adds a third problem: it explains why seasons of sixteen or more episodes complete slightly better than seasons of eleven to fifteen by pointing to soaps and anime, which is an admission that the groups differ by genre and not only by length.
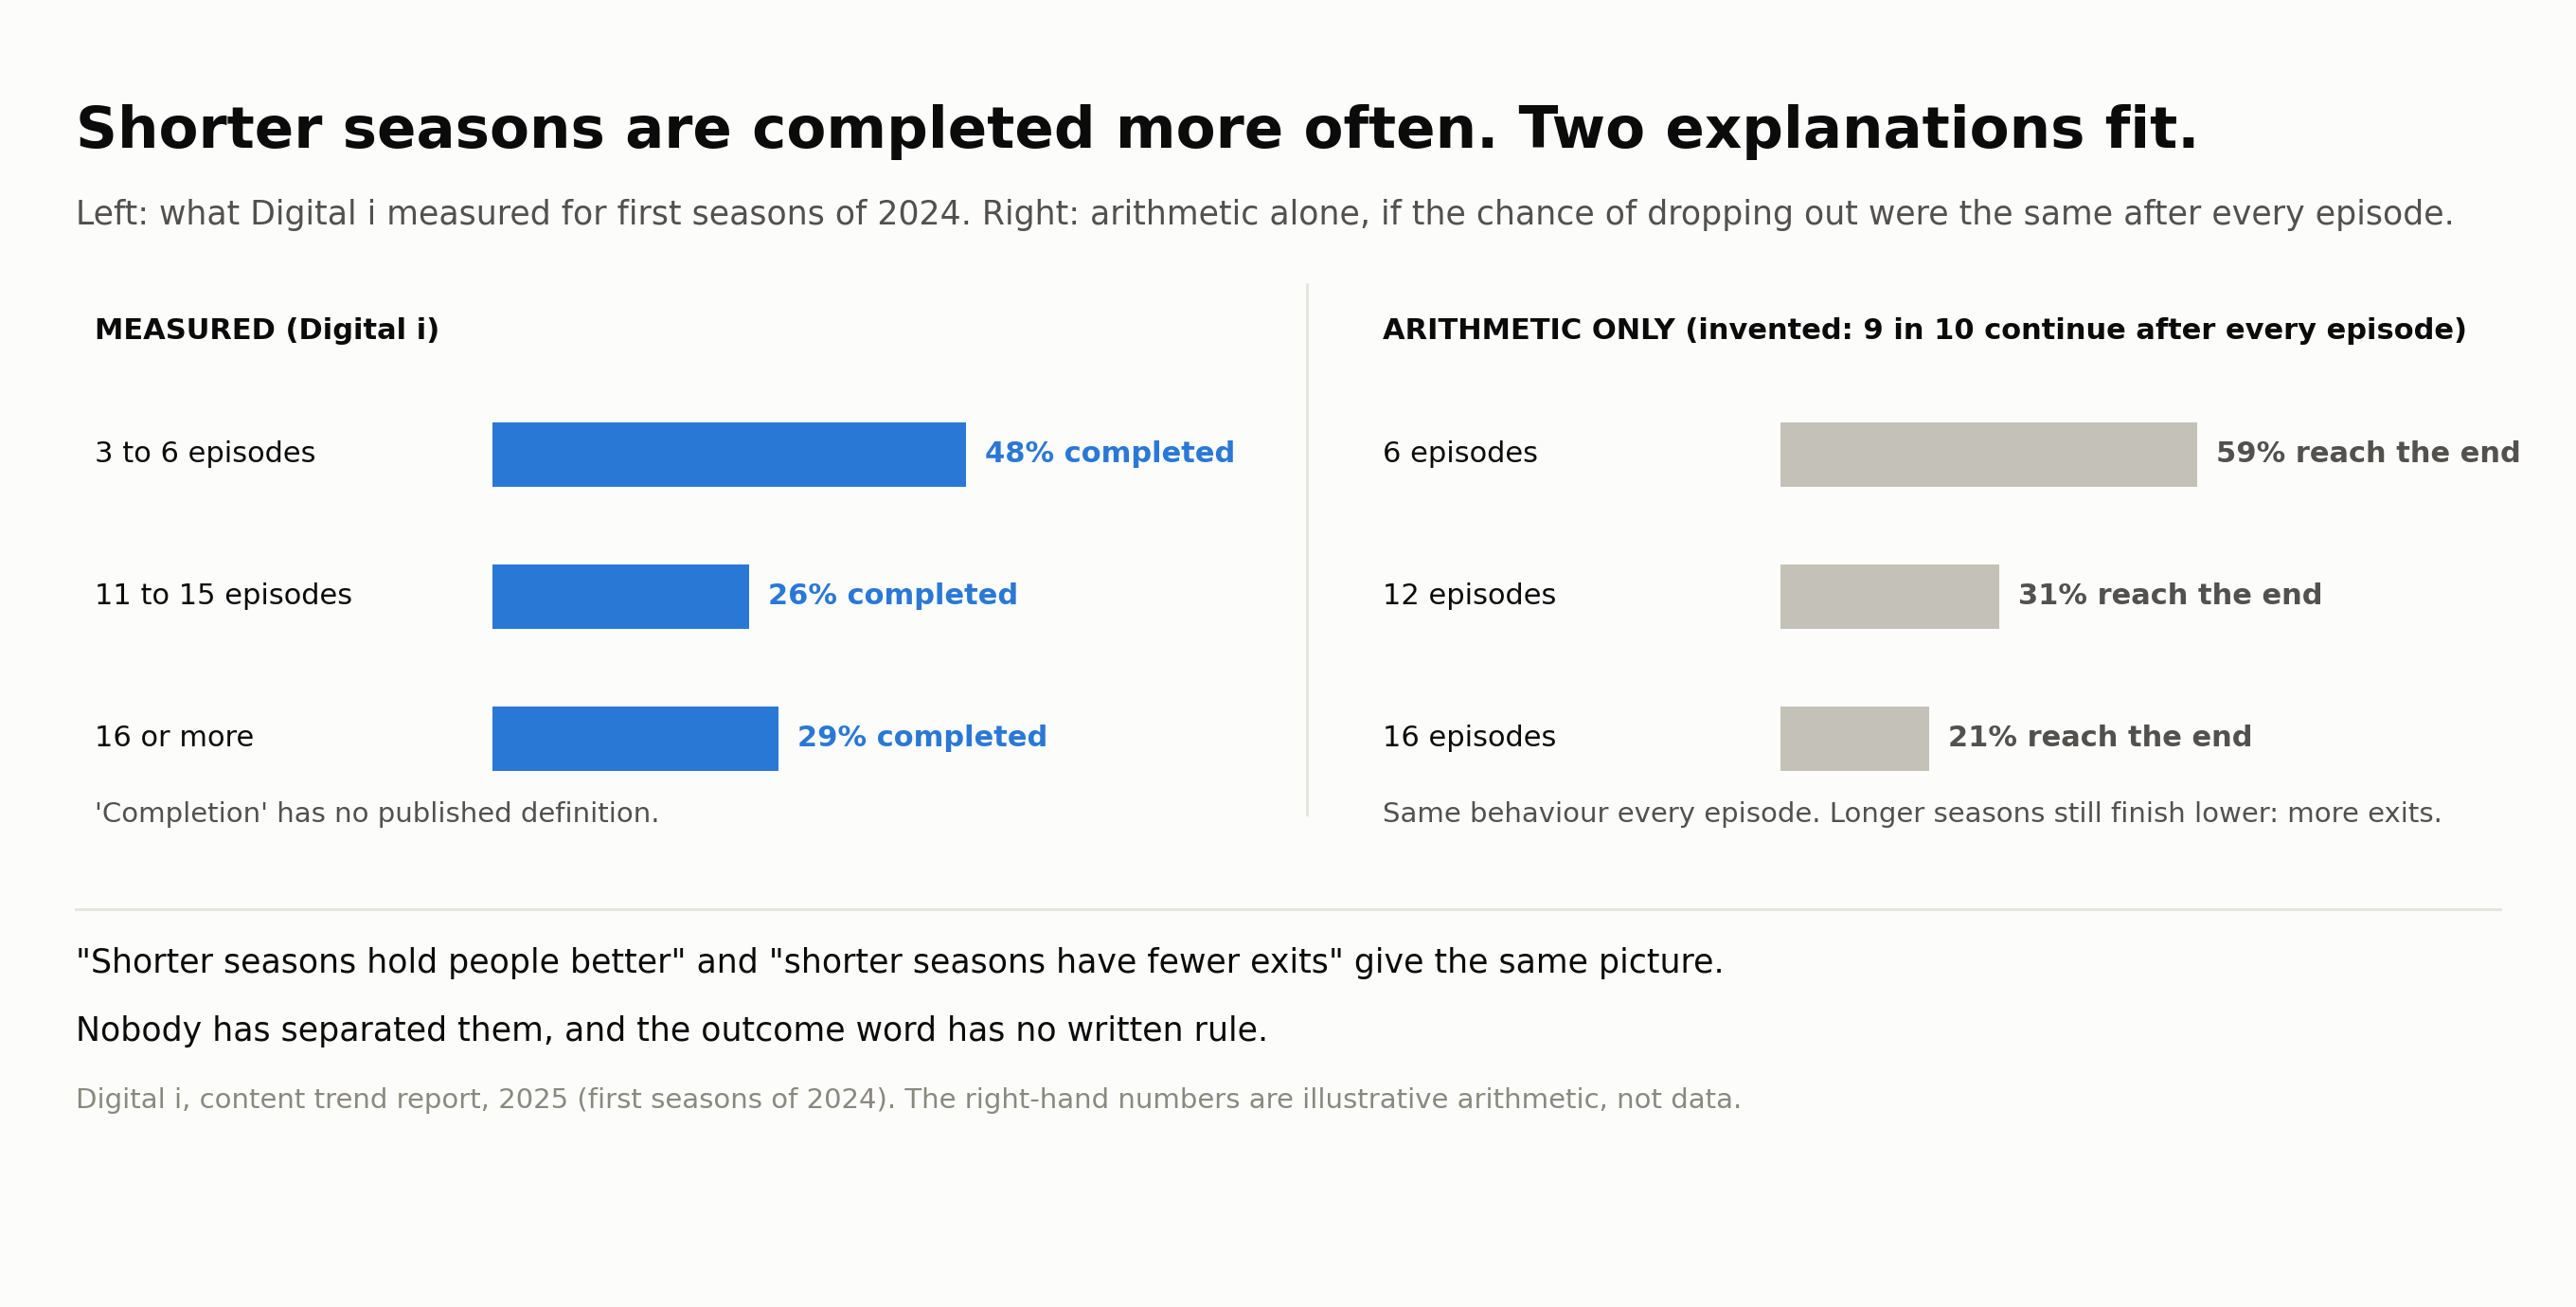
Shorter seasons are completed more often. Two explanations fit.
So the one column with evidence behind it has evidence you cannot use yet. The outcome it is measured against has no written definition, and the pattern it shows has two explanations that nobody has told apart.
That is the last column. Now put them side by side.
What the columns add up to
Go back to the spreadsheet and sort its columns by what they are.
Language, episode count, runtime: objective. A minute is a minute, an episode is an episode, and anyone who reads the cell reads the same value. That is all “objective” means. It does not mean useful. Runtime has never been measured against anything, and the one number behind episode count rests on a word with no definition.
Genre: subjective all the way down. A category standing in for a feeling, and a feeling has no unit. Netflix found that out by trying harder than anyone.
Cast: objective in the cell, subjective in what it means. Who is in the show is a fact. What that name is worth is a judgement that mixes a star with a famous person, and the best-measured thing about it is your distribution deal.
Showrunner: a track record, which is a fact about the past that cannot be separated from the other fact, that working shows go to working showrunners.
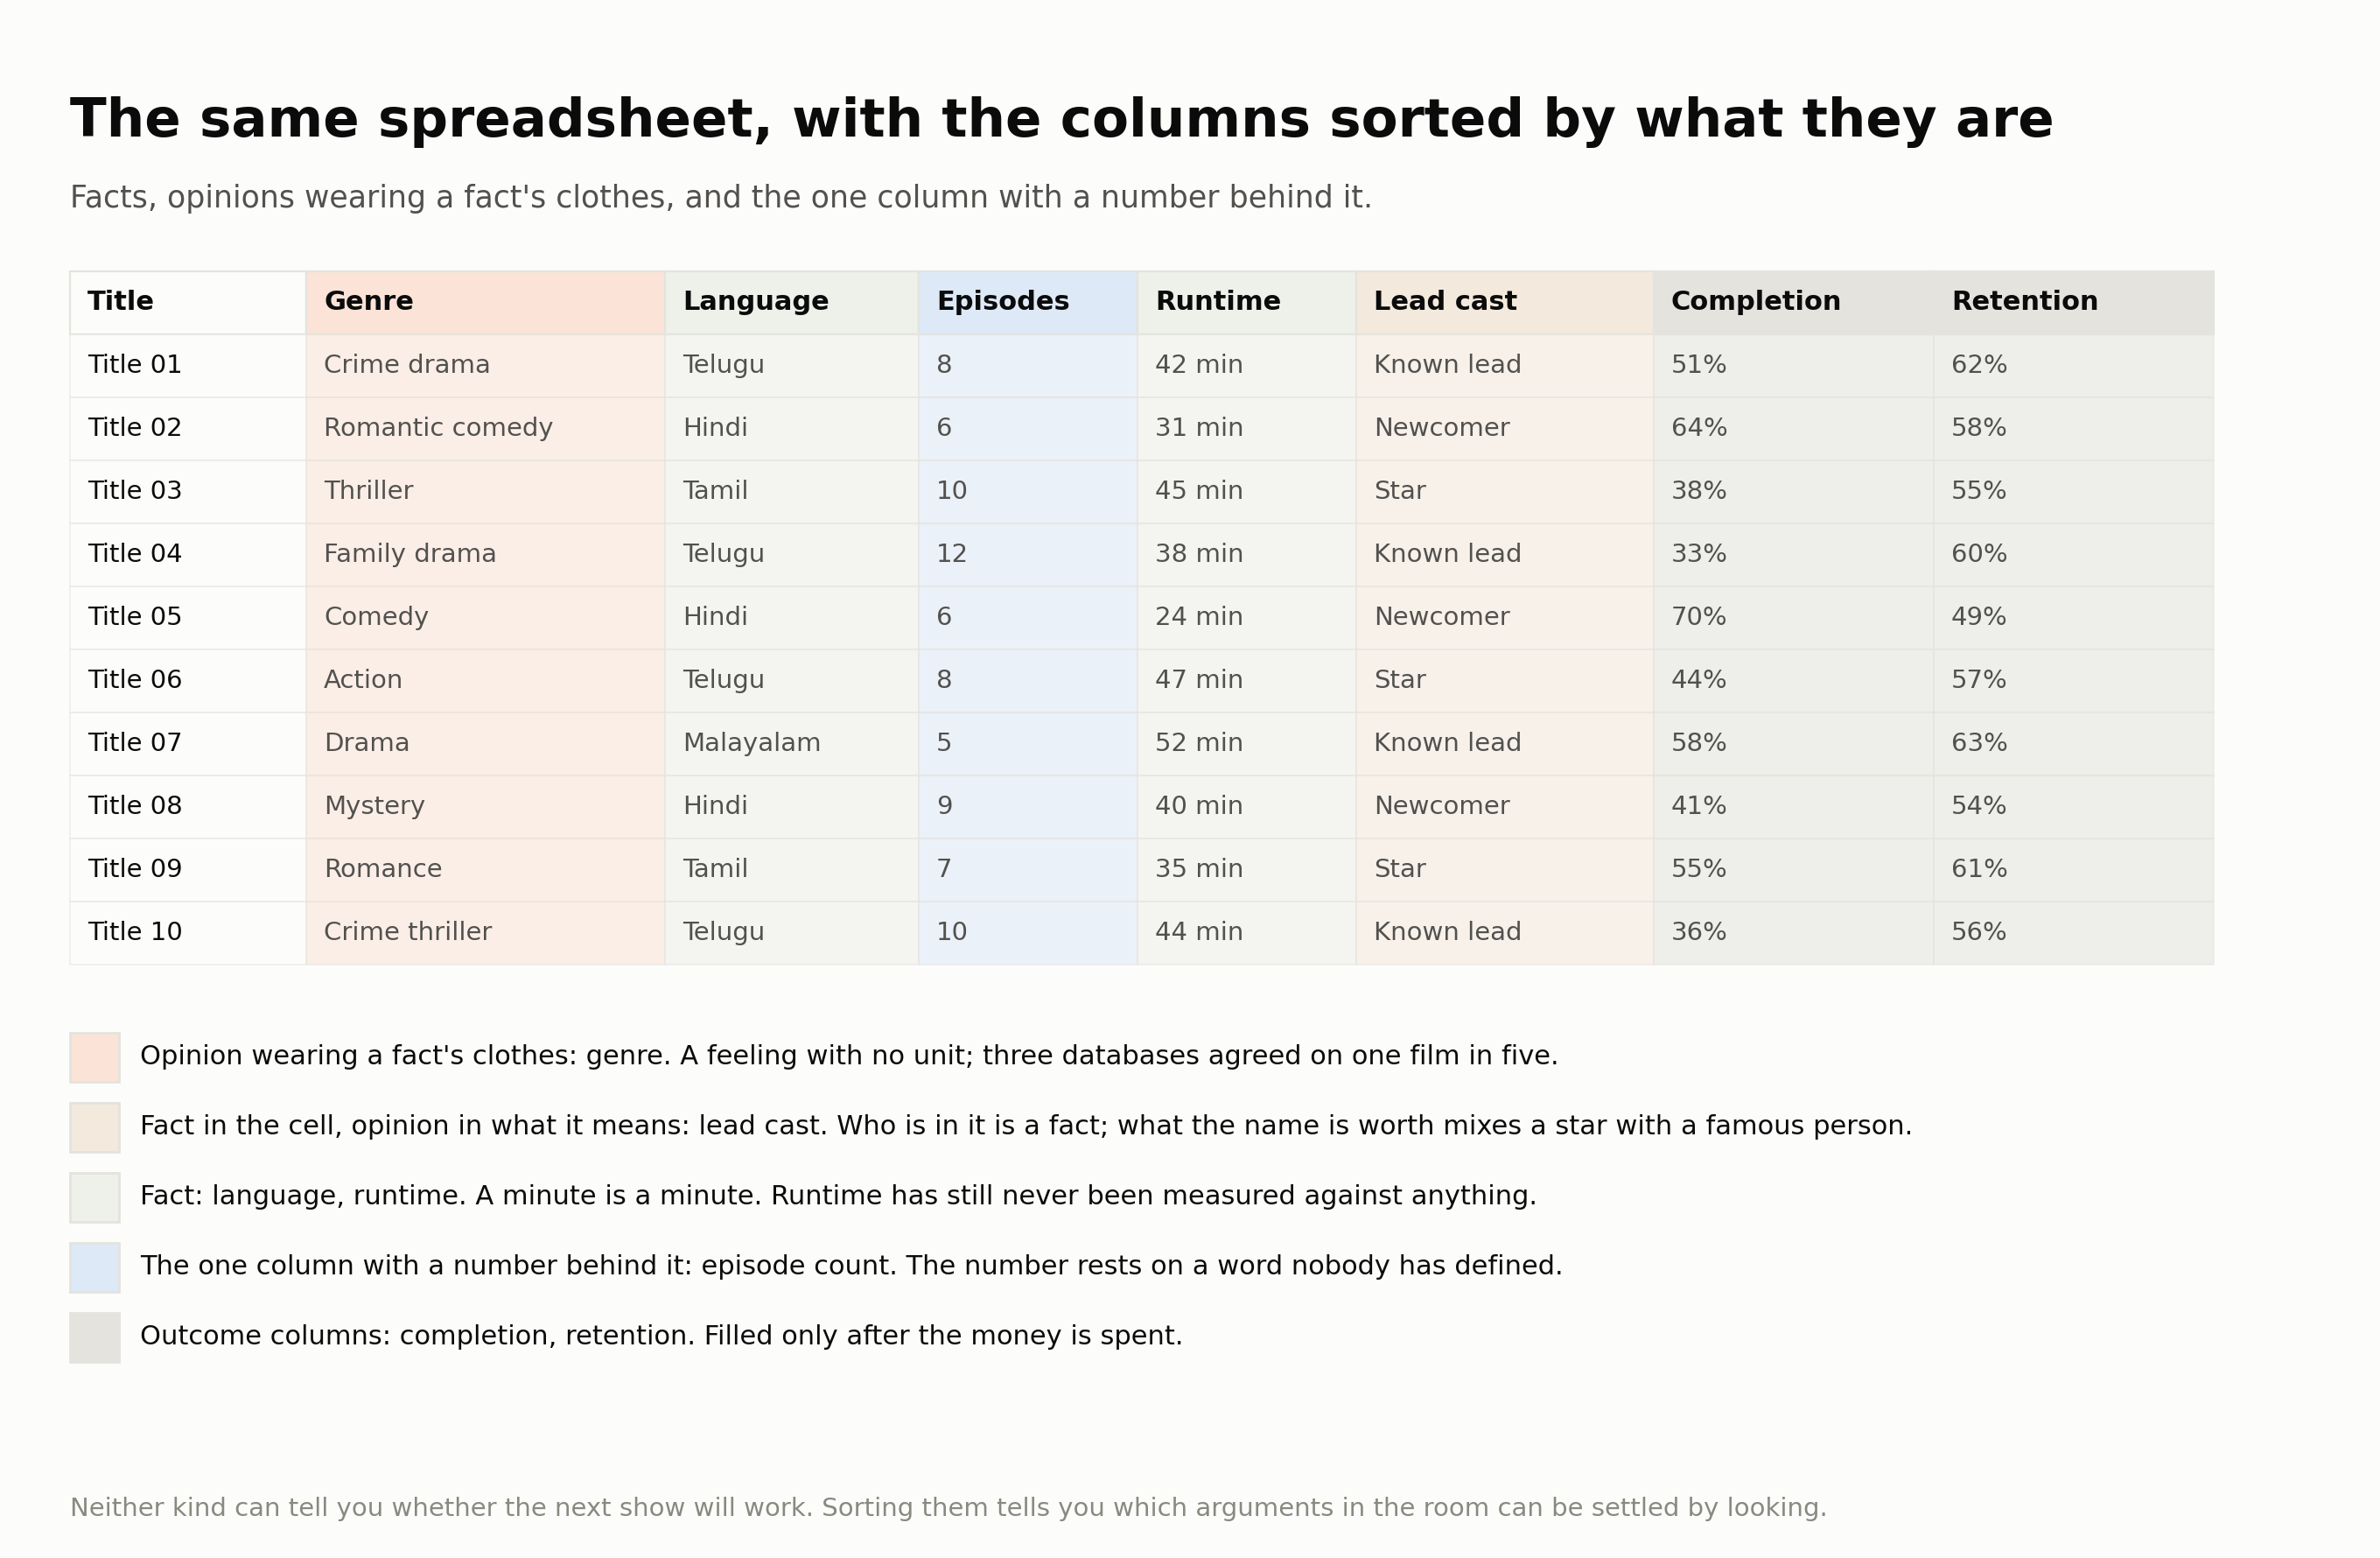
The same spreadsheet, with the columns sorted by what they are.
So the table divides in two: columns that are facts, and columns that are opinions wearing a fact’s clothes. Neither kind can tell you whether the next show will work, because before anything is made there is nothing to measure. The point of sorting them is different. It tells you which arguments in the commissioning room can be settled by looking and which cannot, so that the room stops arguing about taste as if it were data, and spends its judgement where nothing else will do.
If this reads nothing like a commissioner’s day, that is the point
Nobody in a commissioning meeting does any of this. I did not, for most of the years I sat in one. A script comes in, a producer walks you through it, somebody says the name of an actor, and something in you has said yes or no before anyone has opened a spreadsheet. The columns come afterwards, to justify the answer. That is not a failure of discipline. It is how the job works. The job is to decide before anything can be measured, and instinct is the only instrument that works at that speed.
But an instinct is not a gift. It is a record, and it is worth being exact about what it records. It records the first show you were close to that worked, and the reason everyone in the commissioning room gave for why it worked, which became a rule you have applied ever since without checking whether the reason was the cause. It records the miss that got blamed on the genre, or the lead, or the length, when the commissioning room needed something to blame and those were the columns to hand. It records what the senior person said in your first year, delivered with a certainty you had no way to test and never went back to. It records which producers talked well in the commissioning room, which is a skill, and is not the same skill as making a show. It records what the trade press repeated often enough that it began to sound like a measurement. And it records the names that were big the year you started, and keeps pricing them at that year’s value. Most of what it learned is true. Some of it is only what those commissioning rooms believed. From the inside you cannot tell which is which, because both feel exactly the same. That is what a bias is: a lesson learned from a commissioning room that was wrong, filed alongside the ones learned from rooms that were right, in the same handwriting.
That is what this series has been about, from the first piece. Part one argued that data can tell you how to make a thing and how to be less wrong about it, but it cannot tell you what to make; the choice stays with the person, and the person runs on instinct. Part two showed what one trusted number does when nobody looks at the number next to it: short-drama apps are the best in their category at getting people to pay and the worst at keeping them, and a commissioner who reads the first figure without the second builds the wrong thing with great confidence. This piece took the instinct’s raw material, the columns it was trained on, and sorted them: which are facts, which are feelings, and why even the facts do not tell you what will happen.
The only way to sharpen an instinct without its biases is to take it apart. Not to replace it with a spreadsheet, which cannot do the job, but to lay out the parts it runs on, one at a time, and look at each one in daylight. This is a fact. This is a feeling. This is a rule that worked once, for one show, in one year, and has not been tested since. This is something a senior person told me in my first year that I never checked. This is a belief the whole industry holds because it was repeated until it sounded measured. This is a name I still price at the value it had when I started. That is the slowest and least glamorous work in the building. It looks nothing like a day in the job, and it never will, which is why almost nobody does it. The few who do are not smarter than the commissioning room. They are a little less wrong than it, in a business where a little less wrong, compounded across a slate, is the whole game.
Where this goes next
That is the columns. The rows are worse. Your table has a row for every title you made and none for the ones you passed on, and it turns out the passes are where a commissioner’s judgement is actually recorded, and the only place the evidence about whether it was any good could ever come from. That is the next piece. After it, whether judgement can be trusted at all in a commissioning room like this one, which is the one I most want to write.
Karthik Vamsi Tadepalli built the content function at aha and has spent the last year researching the vertical micro-drama market in Telugu.